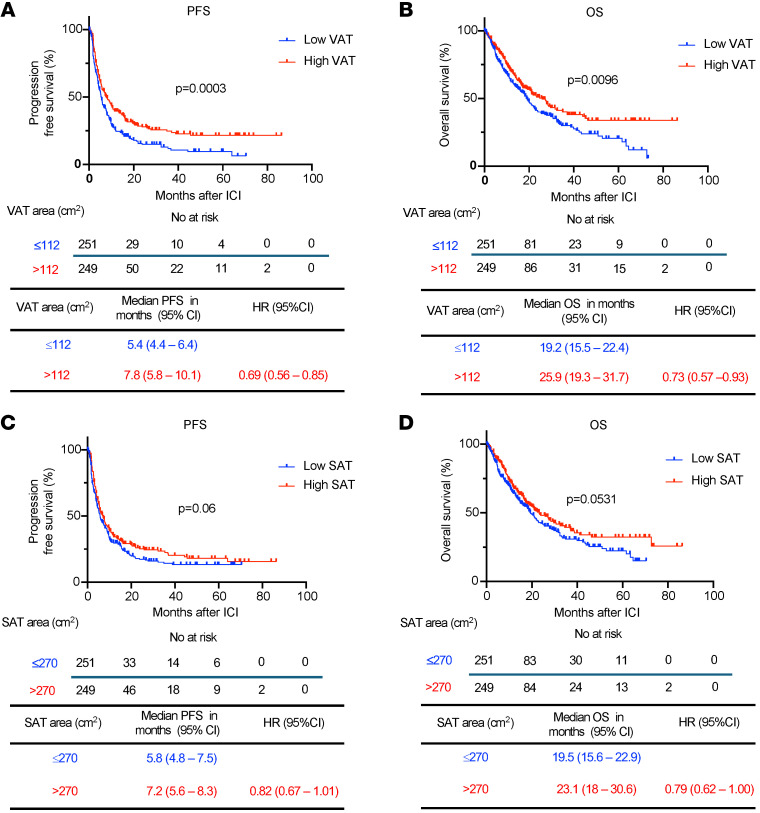
Figure 4. Survival outcomes after ICI in EC stratified by VAT and SAT area.
Kaplan-Meier curves for (A) PFS and (B) OS in patients with EC following ICI treatment stratified by low and high VAT area (n = 500) (low VAT area: ≤112 cm2 in blue; high VAT area: >112 cm2 in red). Kaplan-Meier curves for (C) PFS and (D) OS in patients with EC following ICI treatment stratified by low and high SAT areas (low SAT area: ≤270 cm2 in blue; high SAT area: >270 cm2 in red) (n = 500). Patients were categorized as low or high VAT/SAT based on the median SAT and VAT of the entire cohort. P values in the PFS and OS plots were calculated using a log-rank test.

