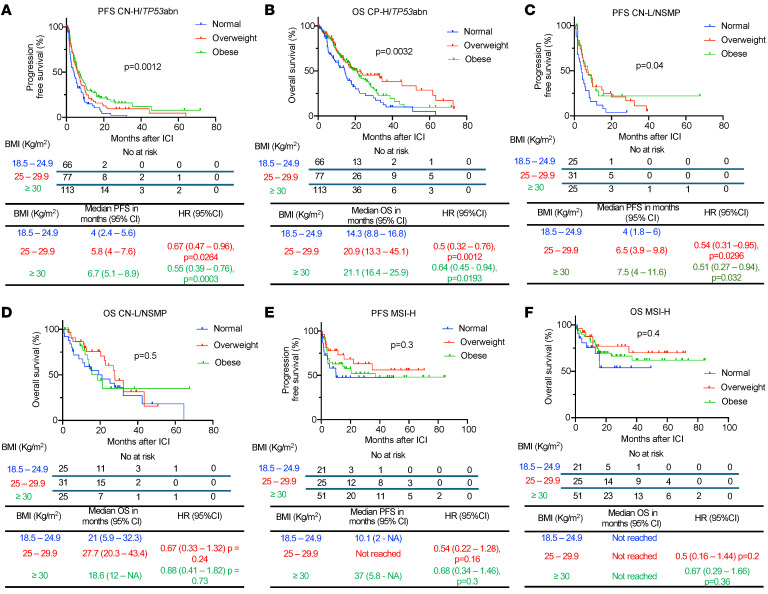
Figure 5. Survival outcomes following ICI in EC patients stratified by BMI across different molecular subtypes.
Kaplan-Meier curves for (A) PFS and (B) OS in patients with CN-H/TP53abn EC following ICI treatment stratified by BMI (normal: BMI 18.5–24.9 kg/m2 in blue; overweight: BMI 25–29.9 kg/m2 in red; obese: BMI >30 kg/m2 in green) (n = 256). Kaplan-Meier curves for (C) PFS and (D) OS in patients with CN-L/NSMP EC following ICI treatment stratified by BMI (n = 81). Kaplan-Meir curves for (E) PFS and (F) OS in patients with MSI-H EC following ICI treatment stratified by BMI (n = 97). P values in the OS plots were calculated using a log-rank test. HRs and 95% CIs for overweight and obese patients were calculated using normal weight as a reference.

