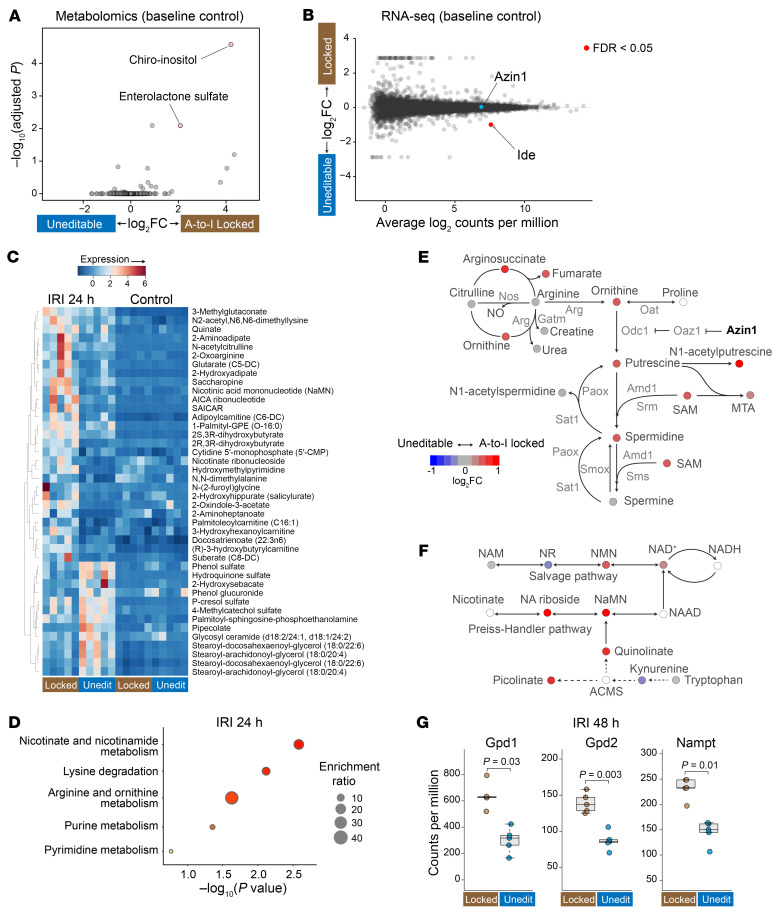
Figure 5. Azin1 A-to-I–locked state limits kidney injury by upregulating polyamines and other protective pathways.
(A) Volcano plot showing the top 2 differentially expressed metabolites. The x axis depicts the log2 fold change of A-to-I locked/uneditable ratio, and the y axis depicts –log10 adjusted P values. Global untargeted metabolomics, n = 5 for each condition. (B) RNA-Seq gene expression analysis (smear plot) comparing homozygous A-to-I–locked and uneditable mouse kidneys under basal conditions. Only Ide (insulin-degrading enzyme) met the criteria of FDR < 0.05 (https://connect.posit.iu.edu/azin1_mouse_kidney/). (C) Heatmap displaying the top differentially expressed metabolites between Azin1-locked and uneditable mice after IRI (adjusted P < 0.05 for all listed metabolites). (D) Pathway enrichment analysis of differentially expressed metabolites between Azin1 A-to-I–locked and uneditable mouse kidneys after IRI. (E) Metabolite ratios (log2 fold change of A-to-I locked/uneditable) mapped to the polyamine pathway and pseudocolored according to the indicated scale. Metabolites with blank circles were not resolved by the metabolomics. (F) Metabolite ratios mapped to the NAD+ biosynthesis pathway. (G) RNA-Seq read counts for glycerol-3-phosphate dehydrogenase 1, cytoplasmic (Gpd1), glycerol-3-phosphate dehydrogenase 2, mitochondrial (Gpd2), and nicotinamide phosphoribosyltransferase (Nampt), 48 hours after IRI.

