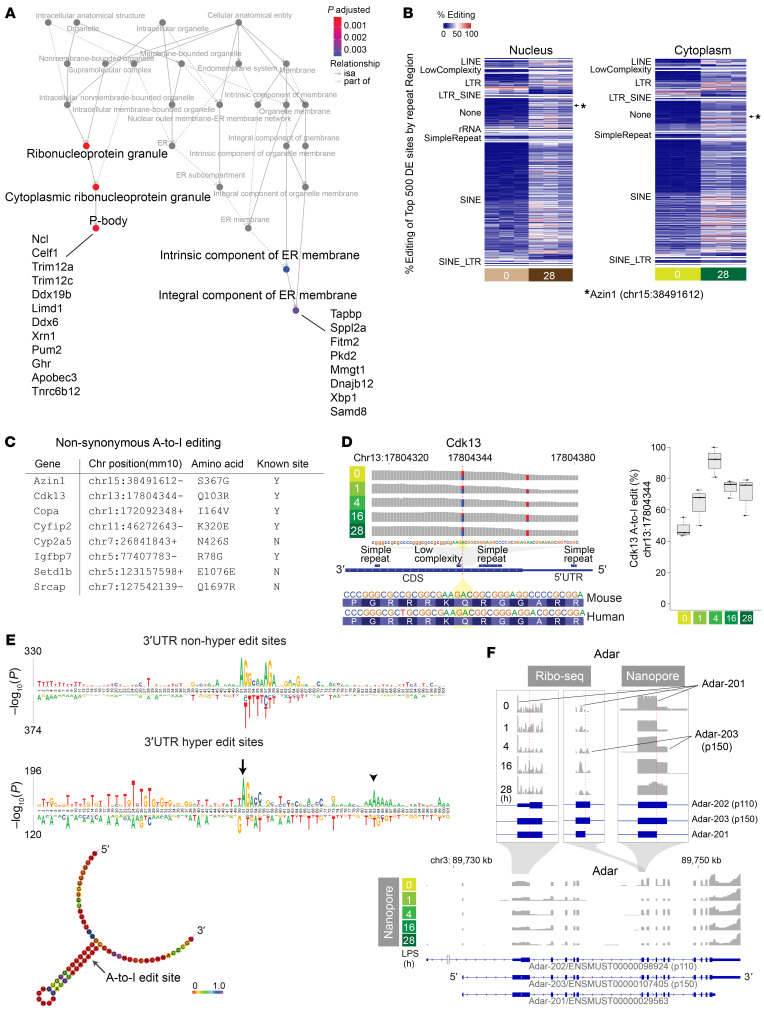
Figure 7. Genome-wide characterization of A-to-I editing in mouse kidneys.
(A) Pathway enrichment analysis based on genes that exhibit differential editing rates between baseline and 28 hours (cytoplasmic compartment). isa, inferred from sequence alignment. (B) Heatmap displaying the top 500 differentially expressed A-to-I editing sites between 0-hour baseline and 28 hours after endotoxin in the kidney. The differentially expressed (DE) sites are categorized based on repeat classes. (C) List of genes exhibiting non-synonymous A-to-I coding sequence mutation in response to an endotoxin challenge in the kidney. (D) Cdk13 reads distribution and A-to-I editing under indicated conditions. (E) Comparison of motif enrichment between non-hyper-editing (top) and hyper-editing sites (bottom) within ±50 nucleotides centered around A-to-I editing sites. Predicted RNA secondary structure around the 3′-UTR hyper-editing site is shown at the bottom (arrow). Positional entropy is color-coded. (F) Ribo-Seq and nanopore read coverage graphs for Adar, clarifying Adar transcript isoform switches during endotoxemia.

