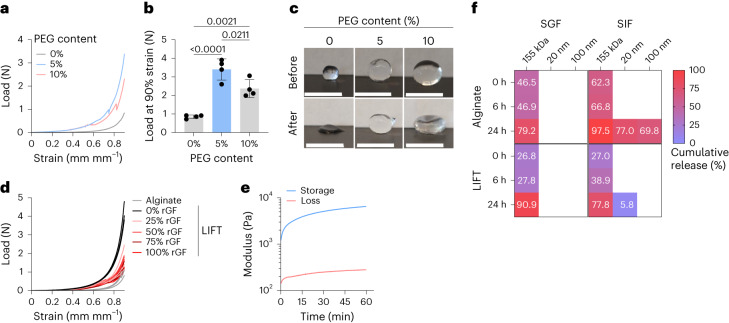
Fig. 2. In vitro characterization of LIFT hydrogels.
a, Representative load–strain curves of LIFT hydrogels comprising 0%, 5% or 10% w/v four-arm PEG–maleimide crosslinked in CaCl2/PEG–dithiol for 20 min, 37 °C, 50 RPM. b, Load at 90% strain of the different hydrogel compositions; n = 4 hydrogels were tested. Statistical analysis was performed by one-way ANOVA with post-hoc Tukey’s multiple comparisons test, n = 4 independent experiments. Data are presented as mean ± standard deviation. c, Images of various compositions of hydrogels before and after 90% strain. Scale bars, 5 mm. d, Load–strain curves of LIFT hydrogels formed in various % v/v mixtures of real porcine gastric fluid (rGF) and water containing CaCl2/PEG–dithiol. e, Gelation kinetics of LIFT hydrogels immersed in a crosslinker bath comprising CaCl2/PEG–dithiol at 37 °C, as characterized by rheology. f, Cumulative release of 155 kDa dextran and 20- or 100-nm nanoparticles from alginate and LIFT hydrogels. Hydrogels were incubated in SGF or SIF for the indicated time periods. Shown is the average of n = 3 independent experiments.

