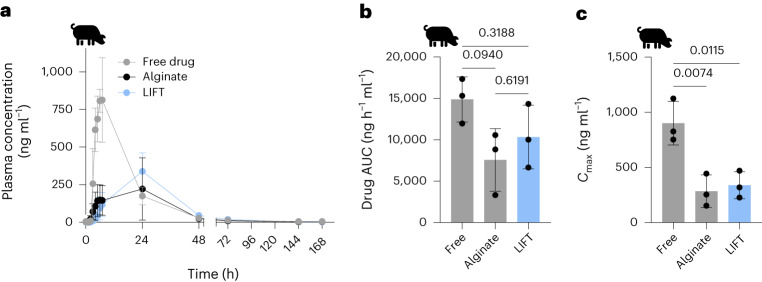
Fig. 4. Pharmacokinetics of various oral lumefantrine formulations.
a, Plasma lumefantrine concentration over time of free lumefantrine and lumefantrine encapsulated in alginate or LIFT hydrogel. For each treatment, n = 3 female Yorkshire pigs were tested. b, Lumefantrine AUC of each formulation. c, Maximum observed lumefantrine concentration (Cmax) of each formulation. For b and c, statistical analysis was performed by one-way ANOVA with post-hoc Tukey’s multiple comparisons test, n = 3 Yorkshire pigs per treatment. All data are presented as mean ± standard deviation.

