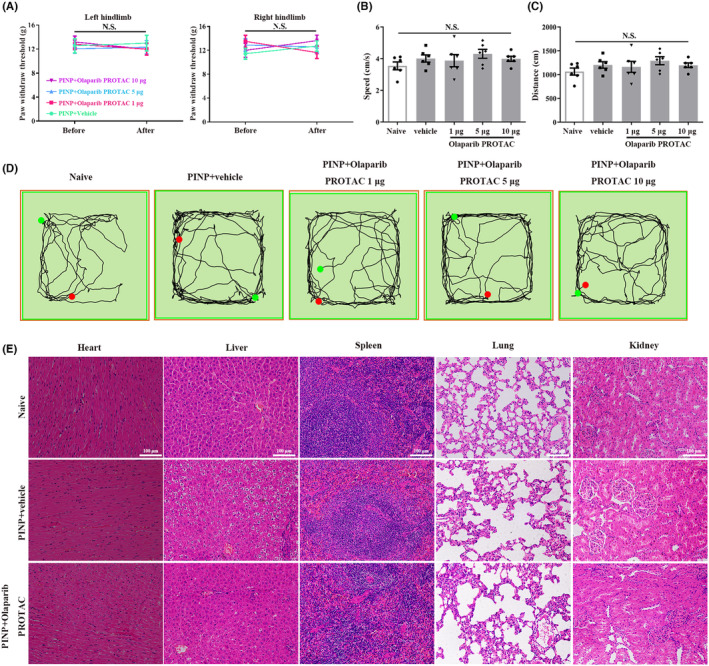
FIGURE 4.

The effects of Olaparib PROTAC administration on motor function and organ structure for toxicity evaluation. (A) The PWTs before and after intrathecal catheter implantation revealed no remarkable differences on both hindlimbs in each group. Two‐way ANOVA followed by Bonferroni post hoc test, p > 0.05, n = 7–8 per group. (B–D) No remarkable differences in the total distance and average velocity were observed among all groups. One‐way ANOVA followed by Bonferroni post hoc test, p > 0.05, n = 6 per group. (E) Representative photomicrographs of H&E staining of heart, liver, spleen, lungs and kidneys. Scale bar: 100 μm, n = 3 per group.
