FIGURE 6.

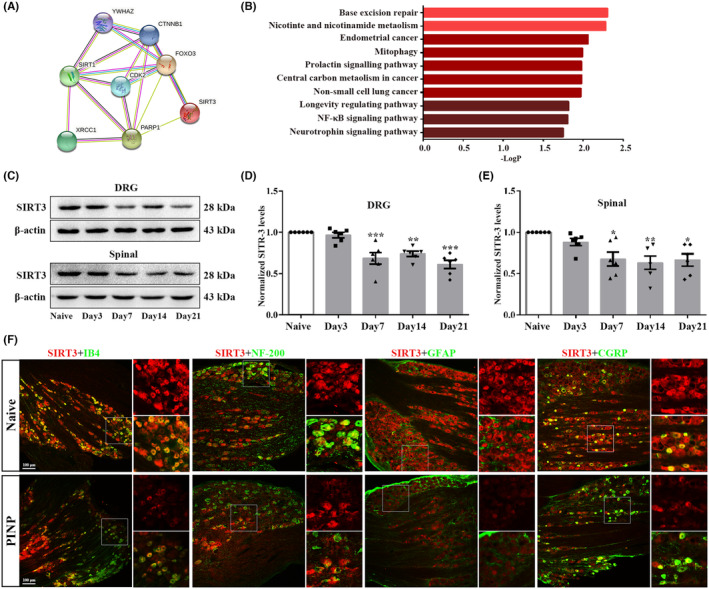
Identification of SIRT3 as a target through which PARP‐1 overactivation regulated the imbalance in mitochondrial oxidative metabolism in the PINP rats. (A, B) PPI analysis and KEGG pathways demonstrated an interaction network between PARP‐1 and SIRT3 along with the related signaling pathways. Species origin: Homo sapiens. Yellow line: Textmining. Blue line: From curated databases. purple line: Experimentally determined. black line: Co‐expression. (C–E) The levels of SIRT3 in the DRGs and spinal cord were decreased from day 7 to day 21 following paclitaxel injection. One‐way ANOVA followed by Bonferroni post hoc test, *p < 0.05, **p < 0.01, ***p < 0.001 versus Naïve group, n = 6 per group. (F) Representative double‐immunofluorescence staining of SIRT3 and IB4, NF‐200, CGRP or GFAP in the DRGs in each group. Scale bar: 100 μm, n = 3 per group.
