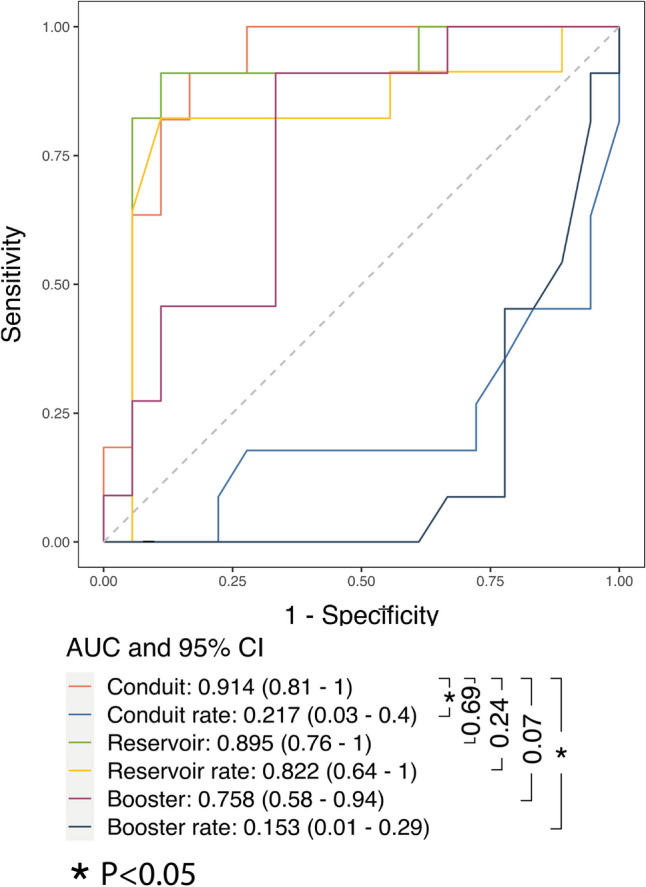
Fig. 4.

Time-dependent ROC curves at t = 12 months. This graph visually evaluates the performance of survival models adjusted for age, diabetes, pericardial effusion (thickness), and BSA-indexed left ventricle stroke volume in predicting adverse pericardial events within a 12-month timeframe. It reports the areas under the curve along with their corresponding 95% confidence intervals. Vertical whiskers denote statistical comparisons of the area under the curve values
