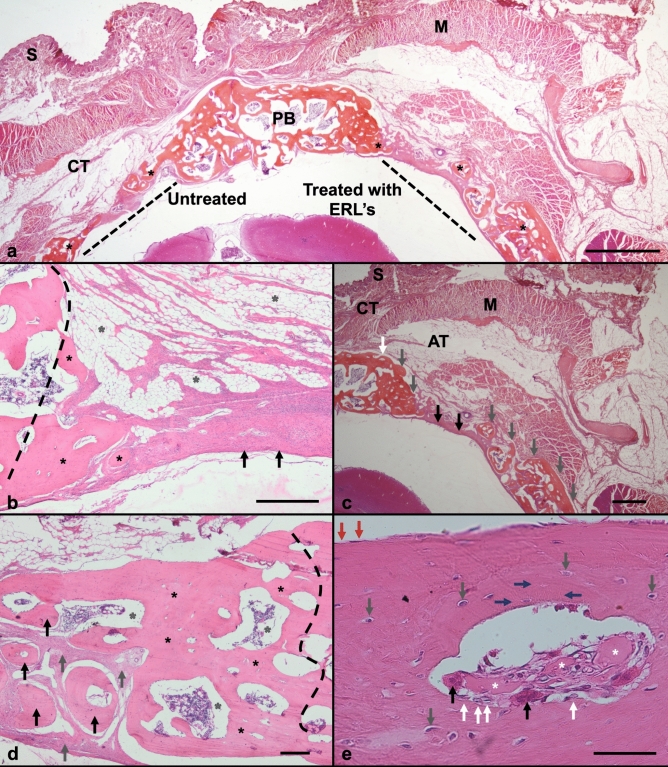
Figure 7.
Histological photography from decalcified samples and stained by H&E. (a) Panoramic image from bone defect area (BDA) on rabbit calvaria, it was showing (right) treated side by ELRs (BDT) and (left) untreated side (BDUT), at 90 days post-surgery. From top to bottom: skin (S), connective tissue (CT), muscle (M), parietal bone (PB), bone defect area (BDA), and brain. Bone formation (black asterisk) was observed on BD untreated and treated edges. The new bone inside BDT had similar thickness to normal bone. Also, multiple bone formations co-called ossicles were observed 6.3 X. Scale bar = 2 mm. (b) On BDUT area was trace (black dashed line) the defect edge, cover it by new bone formation (black asterisks). On its top shows fibro-adipose connective tissue (grey asterisks), under fibroblastic tissue arranged in swirling cells, over bone defect. This shows a biological mechanism to form new bone, in an intramembranous bone like differentiation process (black asterisks). 400X. Scale bar = 200 μm. (c) On BDT edge (white arrow) new bone (grey arrow) was found. Scarce fibroblastic tissue (black arrow) and new bone formations (grey arrows) covered BDT area. Also, hematopoietic bone marrow was seen inside ossicles. 6.3X. Scale bar = 2 mm. (d) At BDT, the edge traced (black dashed line) was covered by new bone (black asterisks) with hematopoietic bone marrow at their core (gray asterisks). Also, multiple rounded bone islets (black arrow), surrounded by fibroblastic tissue (grey arrow), were forming. The fibroblastic tissue will be replaced by bone islets grow in diameter until they merge to form a single bone structure. 40X. Scale bar = 200 μm. (e) Higher magnification, In BDT area new bone shows a Haver´s system-like, with ELRs remnants (white asterisks). These acts like foreign body material, with giant cells containing phagocytized material (black arrow). Osteoblast-like cells (white arrow) were seen on bone surface (endosteum). The bone appears in various layers. Osteocytes inside new bone (grey arrow) were connected by its cytoplasmic processes (blue arrow). Resting cells observed (red arrow) on bone tissue external surface (periosteum). 400x. Scale bar = 200 μm.

