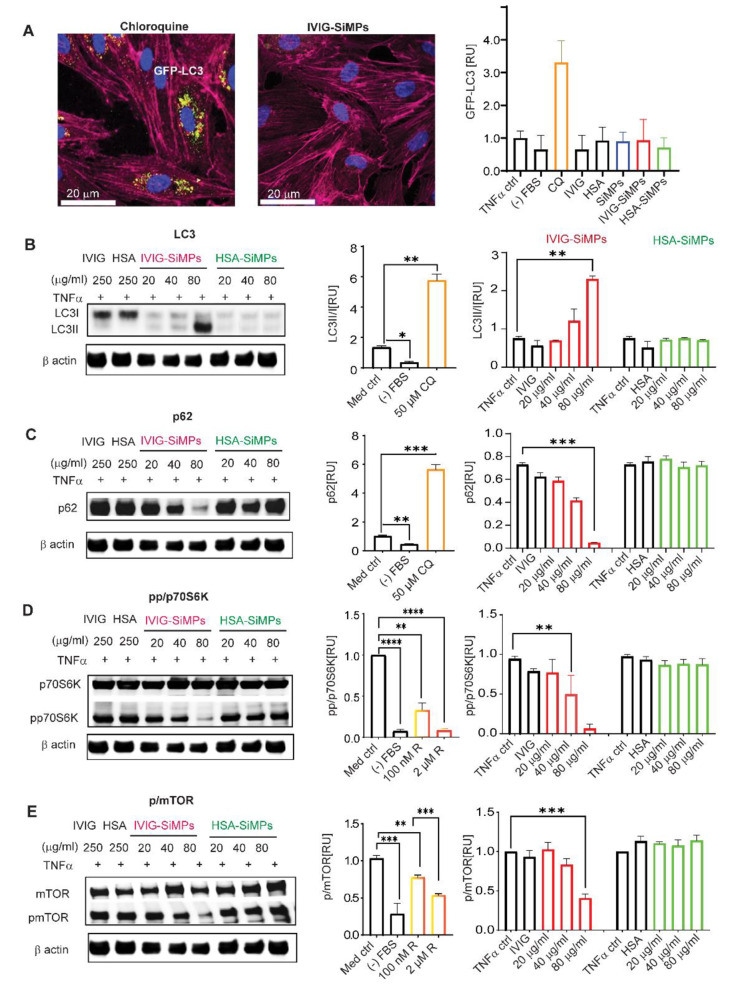
Fig. 5.
IVIG-SiMPs induced mTOR-dependent activation of autophagy in TNFα-stimulated HUVECs. (A) Analysis of autophagosome accumulation by laser scanning confocal microscopy (LSCM). HUVECs were transfected with GFP-LC3 for 24 h. at 37 oC. Subsequently, the cells were treated for additional 24 h. with 100 µg/ml of 200 nm SiMPs, IVIG-SiMPs, or HSA-SiMPs in the presence of 10 ng/ml TNFα. 50 µM chloroquine (CQ) and serum starvation ((-) FBS) served as positive controls. GFP-LC3 fluorescent intensity was observed by LSCM and the intensity was quantified by ImageJ. The cells were washed with Hanks balanced salt solution (HBSS), fixed with 2% paraformaldehyde, and stained with CellMask™ Deep Red Actin Tracking (red) and Hoechst33342 (blue) for 60 min. The slides were mounted with gold antifade mounting media and imaged using a confocal microscope (LSM700) with a 40x oil objective. Scale bars represent 20 μm. Arrows show GFP-LC3 in HUVECs after the treatment. (B) the autophagy markers LC3, (C) p62, (D) p70S6k/pp70SK and (E) mTOR/pmTOR were assessed by Western blot analysis and the band intensities were quantified by ImageJ. HUVECs were treated for 24 h. with varying concentrations (0, 20, 40, 80 µg/ml) of 200 nm SiMPs, IVIG-SiMPs, and HSA-SiMPs in the presence of 10 ng/ml TNFα. 30 µM CQ, 100 nM Rapamycin (R) and serum starvation ((-) FBS) were included as controls. The ImageJ analysis was performed to quantitatively measure band intensities, with the band normalized to β-actin, which was derived from the same samples, and present the values as relative arbitrary units of phosphorylated over non-phosphorylated bands. Mean ± SEM, n = 3, * p < 0.05, ** p < 0.01

