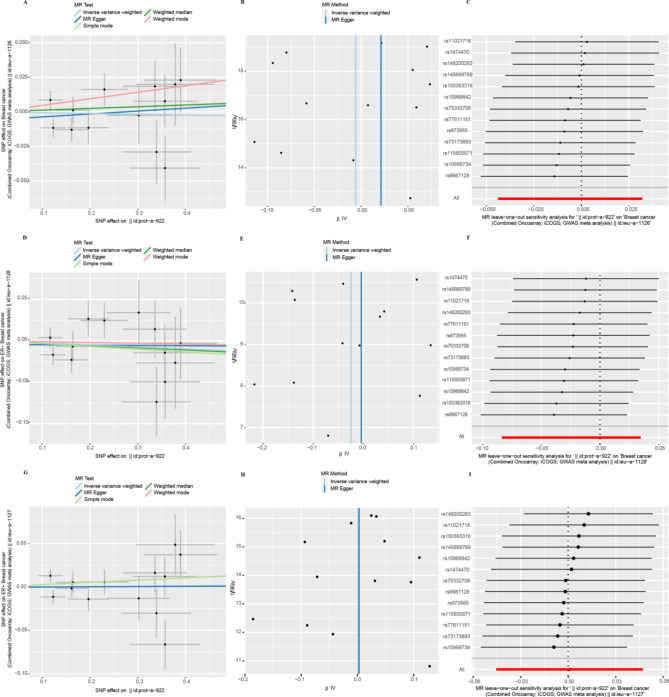
Fig. 5.
Heterogeneity and horizontal pleiotropy testing of the effect of EIF4B on breast cancer and its subtypes (ER−, ER+) risk. (A) Scatter plot, (B) funnel plot, and (C) leave-one-out analysis from genetically predicted the effect of EIF4B on breast cancer. (D) Scatter plot, (E) funnel plot, and (F) leave-one-out analysis from genetically predicted the effect of EIF4B on ER− breast cancer. (G) Scatter plot, (H) funnel plot, and (I) leave-one-out analysis from genetically predicted the effect of EIF4B on ER+ breast cancer.

