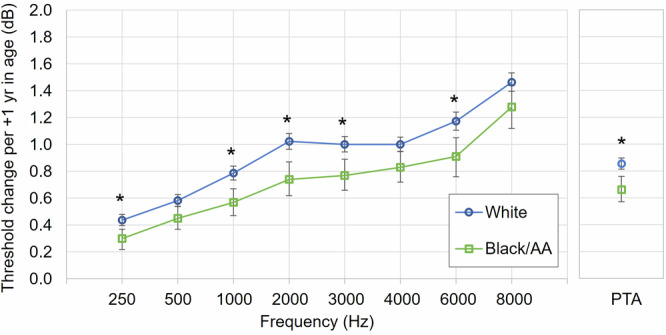
Fig. 2. Average rates of audiometric threshold and PTA change (dB) per year, stratified by race.

Results are presented as Beta coefficients with corresponding 95% confidence intervals (error bars) for white (blue circles; n = 1180) and Black/African American (green squares; n = 246) participants. Estimates are adjusted for sex. *p < 0.05; significance determined by including age*race interaction term in models. Participants who were not white or Black/African American race (categorized as other race) were excluded from these analyses given the small sample size (n = 10; see Table 1). PTA: pure-tone average, calculated from frequencies 500, 1000, 2000 and 4000 Hz averaged across right and left ears. AA: African American.
