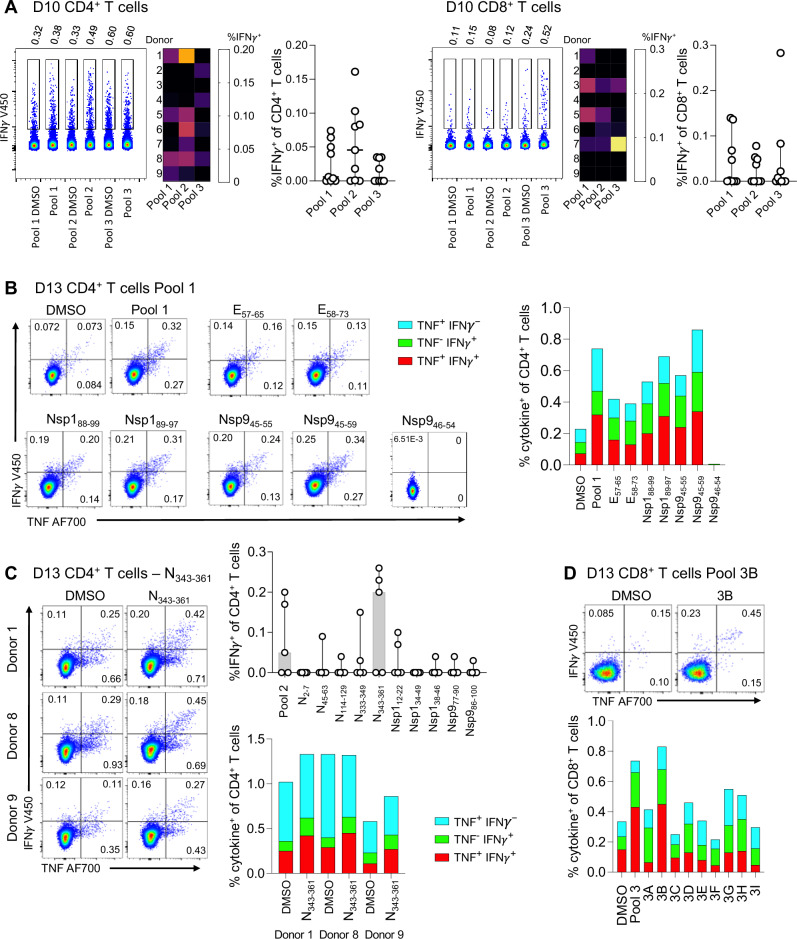
Fig. 6. CD4+ and CD8 + T cell reactivity towards detected SARS-CoV-2 peptides.
A Representative concatenated FACS plots of IFNγ expression in Donor 1 CD4+ and Donor 7 CD8 + T cells in response to peptide pools 1, 2, 3 (left). Frequency of IFNγ + CD4+ and CD8 + T cells across donors following stimulation with peptide pools (background DMSO subtracted). Percentage IFNγ+ of CD4+ and CD8 + T cells depicted as a heatmap (middle) and median with 95% CI is shown (n = 9 donors, mean with SD; right). B Representative FACS plots of CD4 + T cell IFNy+ response (left) of Donor 3. Frequency of IFNγ + TNF + CD4 + T cells after stimulation with individual pool 1 SARS-CoV-2 peptides (right). C Representative FACS plots for CD4 + T cell response to N343-361 (left). Frequency of IFNγ + CD4 + T cells stimulated with pool 2 individual peptides (background DMSO subtracted, n = 5 donors, mean with SD; top). Frequency of IFNγ + TNF + CD4 + T cells after stimulation with DMSO and N343-361 (bottom). D Representative FACS plot of IFNγ + CD8 + T cells (top). IFNγ + TNF+ expression in response to stimulation with peptide pool 3 subpools (bottom). D10/D13 day 10/13, CD cluster of differentiation, IFN interferon, TNF Tumor necrosis factor, DMSO dimethyl sulfoxidy, Nsp non-structural protein. Source data are provided as a Source Data file.

