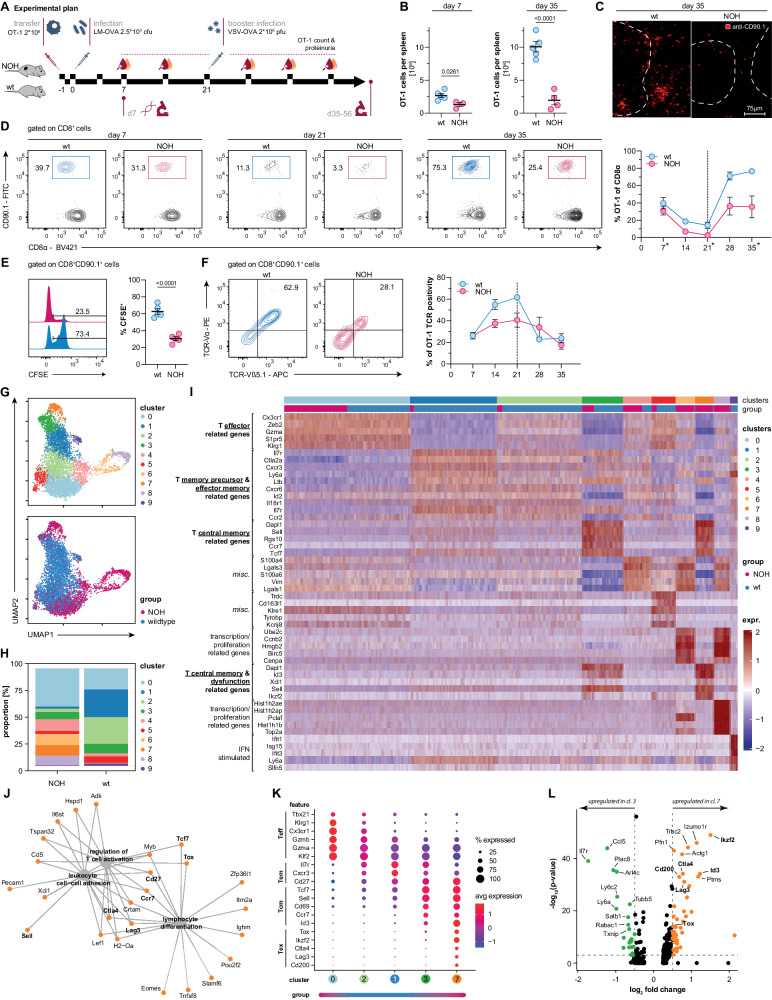
Fig. 1.
OT-1 cells develop a distinct phenotype in an autoreactive environment. A Experimental plan. Initially (d1) 2 × 10⁶ OT-1 cells were i.v. transferred into wt and NOH mice. After 24 h (d0) mice were infected with 2.5 × 10³ cfu of OVA-expressing Listeria monocytogenes (LM-OVA). After 21 days, mice were reinfected/boostered with 2 × 10⁶ pfu OVA-expressing vesicular stomatitis virus (VSV-OVA). Blood and urine samples were analyzed weekly. Final analysis was performed at early (d7) and a late time points (d35–56). B Quantitative flow cytometry analysis depicting less OT-1 cells in the spleens of NOH (red) vs. wt mice (blue) after 7 and 35 days. Total cell numbers were calculated by manually counting lymphocytes of whole organ lysates and multiplying counts with fractions obtained by flow cytometry analysis. C Anti-CD90.1 (red channel) immunofluorescence confirming less transferred OT-1 cells in spleens of NOH (right) vs. wt mice (left). D Representative flow cytometry plots and summary analysis (n = 5 per group) showing quicker decline of transferred OT-1 cells in peripheral blood of NOH mice (red) after primary (d7, d21) and secondary booster infection (d35) compared to wt mice (blue) over time. Dashed line indicating time point of booster infection. E CFSE assay demonstrating faster initial proliferation of transferred OT-1 cells in LM-OVA infected NOH (red) compared to wt mice (blue) after 72 h. F Representative flow cytometry plots showing expression of T cell receptor (TCR) chains Vα2 and Vβ5.1 prior to reinfection (d21). Time-course of TCR expression (right) demonstrating earlier TCR-internalization in NOH (red) compared to wt mice (blue). Dashed line indicating time point of booster infection. G Unsupervised UMAP-clustering of ~7000 OT-1 cell transcriptomes identifying 10 distinct clusters (upper plot). Cells from wt (blue) vs. NOH mice (red) clustered separately (lower plot). H Stacked barplots visualizing cluster composition of NOH vs. wt mice. Clusters 0, 4, 6, 7, and 8 mainly defined NOH-derived cells. I Annotated heat map of cluster-defining transcripts. Top five transcripts were identified by highest significant avgLog2FC values. J GO:BP term enrichment analysis of genes overexpressed in cluster 7. Network depicting linkages of genes and biological processes. K Dot plot illustrating the functional classification of clusters 0, 1, 2, 3, and 7 by curated genes associated with T cell effector, memory and inhibitory features. Bar below indicates if clusters were mainly represented by NOH or wt-derived OT-1 cells. L Volcano plot depicting differentially expressed genes comparing clusters 3 and 7. Dashed lines indicate log2 fold change value of 0.5 and p value of 0.05. If not stated differently, bars and whiskers of dot plots representing flow cytometry data depict means and respective standard errors of the mean (SEM). P values were calculated using unpaired student’s t test. All presented datasets are representative of at least three individual experiments with n ≥ 3 mice/group. To obtain single-cell RNA-sequencing data, OT-1 cells were adoptively transferred into wt and NOH mice and isolated 7 days after LM-OVA infection as depicted in (A). Splenocytes of four mice (two wt and two NOH each) were harvested and FACS-sorted to isolate OT-1 cells. Cells were labeled with antibody bound hashtag oligos and pooled together for sequencing (detailed information provided in “Materials and Methods” section)

