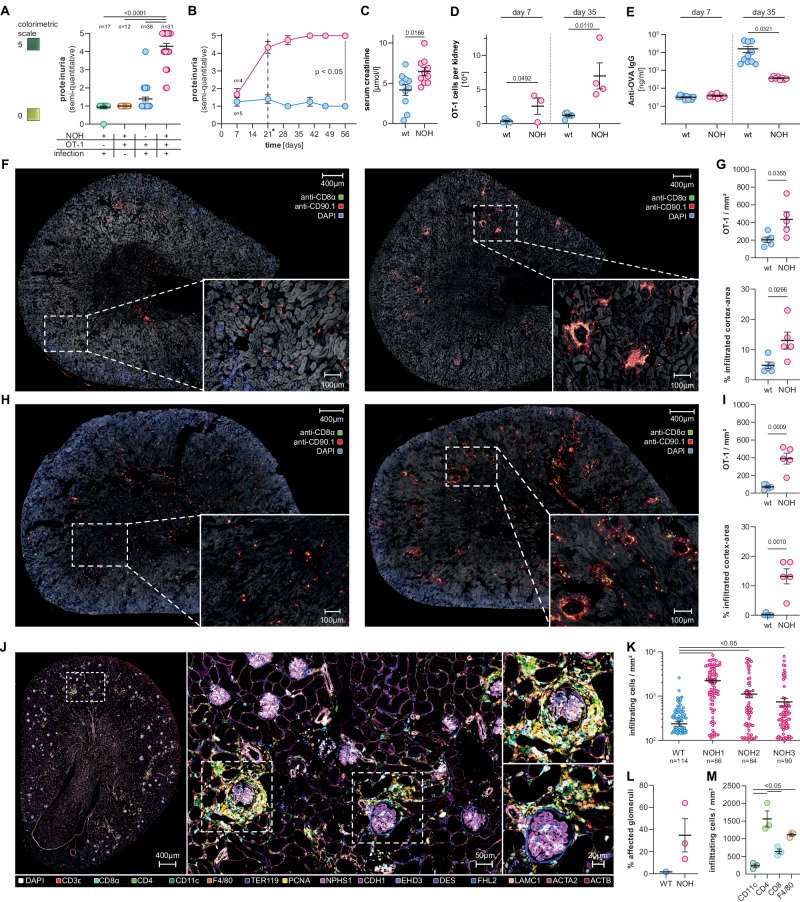
Fig. 3.
Autoreactive OT-1 cells induce a renal phenotype. A Dot plot illustrating semi-quantitative proteinuria assessed via colorimetric dipstick assays after 35 days. NOH mice (red) develop significant proteinuria after OT-1 cell transfer and infection, compared to wt mice (blue) and NOH mice after either infection (green) or OT-1 transfer (yellow). B Time-course showing persistent proteinuria in NOH mice (red). Dashed line indicates time point of booster infection. C Dot plot showing higher serum creatinine levels in NOH (red) vs. wt (blue) mice after 35 days. D Quantitative flow cytometry analysis depicting more OT-1 cells in the kidney of NOH (red) vs. wt mice (blue) after 7 (left) and 35 (right) days. Total cell numbers were calculated by manually counting lymphocytes of whole organ lysates and multiplying counts with fractions obtained by flow cytometry analysis. E Dot plot comparing anti-OVA IgG levels in serum of NOH (red) vs. wt (blue) mice. Lower IgG levels were detected in NOH vs. wt mice after 35 days, indicating a curtailed humoral immune response. F Immunofluorescence of whole kidney sections, labeled with FITC-anti-CD8α- (green channel) and PE-anti-CD90.1-antibodies (red channel), depicting the OT-1 cell infiltration in wt (left) and NOH mice (right) after 7 days. G Dot plots showing higher OT-1 cell density/mm2 (upper graph) and percentage of infiltrated cortex area (lower graph) in NOH (red) vs. wt mice (blue) after 7 days. H Immunofluorescence of whole kidney sections, labeled with FITC-anti-CD8α- (green channel) and PE-anti-CD90.1-antibodies (red channel), depicting the OT-1 cell infiltration in wt (left) and NOH mice (right) after 35 days. I Dot plots showing higher OT-1 cell density/mm2 (upper graph) and percentage of infiltrated cortex area (lower graph) in NOH (red) vs. wt mice (blue) after 35 days. J 16-plex 4i immunofluorescence of whole kidney sections, labeling immune cell entities and structural markers after 35 days. K Dot plot showing a higher number of immune cells per infiltrated periglomerular area in NOH (red) mice. n depicts the number of analyzed glomeruli/sample. Comparison of three NOH mice (red) to wt control (blue). L Dot plot illustrating fractions of affected glomeruli/whole kidney section. M Dot plot illustrating immune-cell composition of periglomerular infiltrates. Bars and whiskers of dot plots depict means and respective standard errors of the mean (SEM). P values were calculated using unpaired student’s t test or one-way ANOVA with post-hoc Tukey’s multiple comparisons method if two or more groups were analyzed. All presented datasets are representative of at least three individual experiments with n ≥ 3 mice/group

