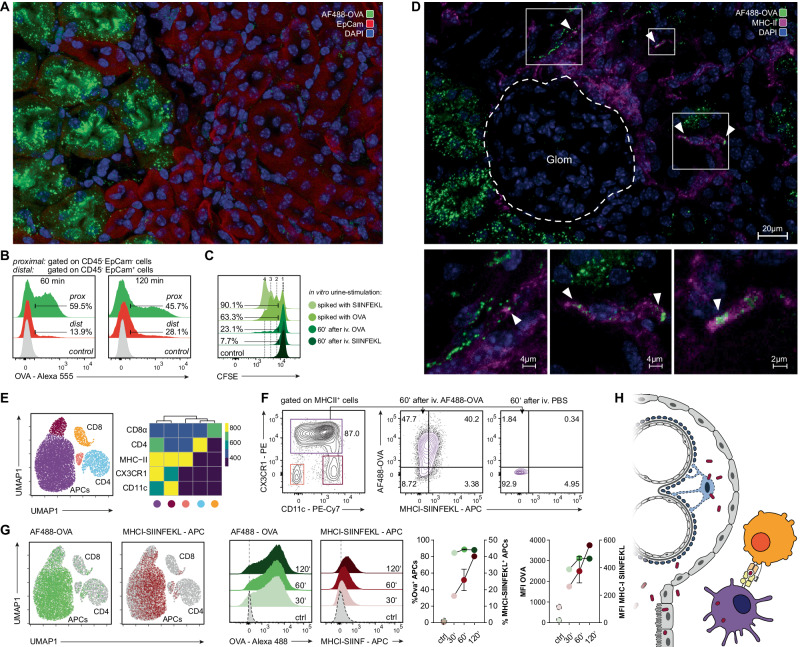
Fig. 4.
Uptake and presentation of ovalbumin in the kidney. A Wt kidney section 60 min after AF488-OVA injection and PBS-perfusion through the renal artery. Representative immunofluorescence showing OVA (green channel) accumulation in proximal tubular cells, identified by low signal of co-staining with anti-CD326 (EpCam)-antibody (red channel). B FACS analysis of proximal (CD45−EpCamlow) vs. distal (CD45−EpCamhi) renal tubular epithelial cells, 60 (left) and 120 min (right) after AF555-OVA injection, demonstrating the OVA uptake in proximal tubular segments. Control: CD45−EpCamlow renal cells 60 min after PBS injection. C In vitro stimulation of CFSE-labeled OT-1 cells for 72 h, demonstrating high effectiveness of OVA uptake in proximal tubular cells. Division rates of OT-1 T cells stimulated with urine of wt mice taken 60 min after i.v. OVA- or SIINFEKL injection were compared to positive controls of OT-1 CD8+ T cells stimulated with urine spiked with OVA protein or SIINFEKL peptide. D Wt kidney section 60 min after AF488-OVA injection (green channel) and PBS-perfusion through the renal artery; co-staining against MHCII. Representative immunofluorescence demonstrating OVA uptake (green channel; ►) in periglomerular MHCII+-antigen-presenting cells (magenta channel). E Unsupervised clustering of kidney cells (dimensionality reduction with UMAP and cluster detection with FlowSOM algorithm applied on flow cytometry data), characterizing the renal immune cell compartment (left) and heat map showing relative marker expression of detected clusters (right). F Representative flow cytometry plots of kidney cell suspensions 60 min after AF488-OVA injection, demonstrating OVA uptake and SIINFEKL-cross-presentation via MHCII+CX3CR1hiCD11cint antigen-presenting cells (central plot). Control: 60 min after PBS injection (right plot). G Superimposition of AF488-OVA (green, left dot plot) and MHCI-SIINFEKL signals (red, right dot plot) on UMAP, demonstrating processing and cross-presentation of injected OVA in antigen-presenting cells (APCs). Histograms illustrating AF488-OVA (green, left histogram plot) and MHCI-SIINFEKL (red, right histogram plot) signals in APCs, 30, 60, and 120 min after AF488-OVA injection. Graphs on the right comparing percentages (left graph) and MFIs (right graph) of OVA+ (green) and MHCI-SIINFEKL+ (red) over time. H Schematic, illustrating cross-presentation of podocyte antigens: dying podocytes release antigens/epitopes (e.g., OVA) within Bowman’s capsule. They are transcellularly transported in the periglomerular space by proximal tubular epithelial cells. Endocytosis and antigen presentation by APCs can initiate adaptive immunity within the kidney

