Fig. 5.
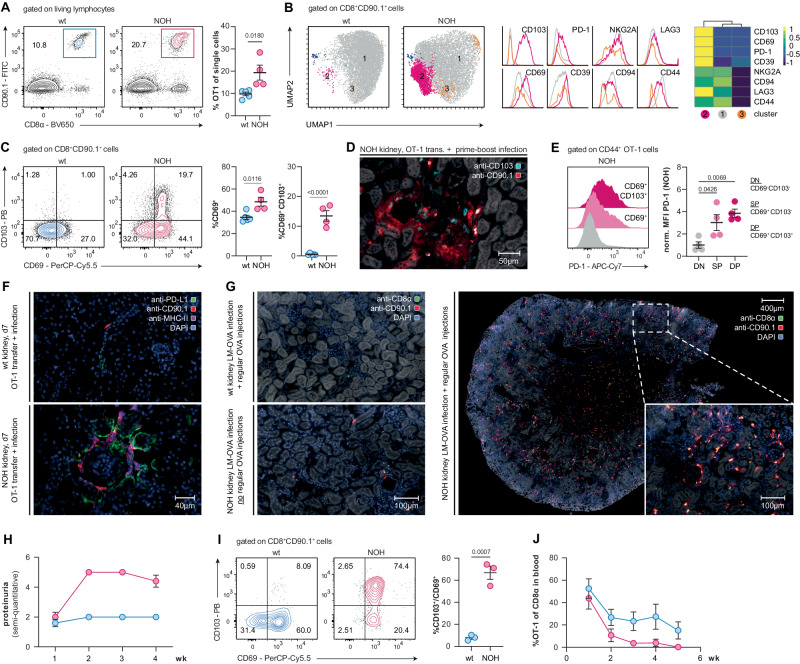
Autoreactive OT-1 cells accumulate in NOH-kidneys originating a potential TRM subpopulation. A Representative flow cytometry plots identifying transferred OT-1 cells in kidney single-cell suspensions. Dot plot (right) showing a significantly higher percentage of OT-1 cells in kidneys of NOH (red) compared to wt mice (blue) on day 35. B Unsupervised clustering of kidney cells (dimensionality reduction with UMAP and cluster detection with FlowSOM algorithm applied on flow cytometry data) depicting a TRM OT-1 cell subpopulation in kidneys of NOH mice (purple cluster [2]; >100 cells required per defined cluster). Marker-specific histograms and summarizing heatmap showing expression of TRM markers CD103 and CD69, as well as higher levels of inhibitory makers (PD-1, CD39, NKG2A, CD94, LAG3) in cells of the purple cluster (2). C Representative flow cytometry plots illustrating CD69 and CD103 expression of renal OT-1 cells on day 35 after heterologous prime-boost infection. Dot plots depicting a higher percentage of CD69+ cells (left) and double positive CD69+CD103+ OT-1 TRM cells (right) in kidneys of NOH (red) vs. wt mice (blue). D Immunofluorescence of kidney section, labeled with APC-anti-CD103- (blue channel) and PE-anti-CD90.1-antibodies (red channel), depicting OT-1 TRM cells in periglomerular infiltrates of NOH mice. E Representative histograms illustrating PD-1 expression of double positive (CD69+CD103+), single positive (CD69+CD103−) and double negative (CD69−CD103−) renal OT-1 cells in NOH mice on day 35. Dot plot comparing normalized mean fluorescent intensities (MFIs) of the PD-1 signal, showing higher PD-1 expression in double positive (CD69+CD103+) vs. single positive (CD69+CD103−) and double negative (CD69−CD103−) renal OT-1 cells. F Representative immunofluorescence of wt (upper picture) and NOH (lower picture) kidney sections, showing elevated PD-L1 expression (green channel) in proximal tubular epithelial cells of infiltrated areas. Co-staining for transferred OT-1 cells (red channel) and renal APCs (magenta channel). G Immunofluorescence of kidney sections, labeled with FITC-anti-CD8α- (green channel) and PE-anti-CD90.1-antibodies (red channel), demonstrating that renal OT-1 infiltration can be detected in NOH mice on day 35 after primary infection, followed by weekly OVA injections (right). No infiltrates were detected in wt mice after infection and weekly OVA injections (upper left) and NOH mice after primary infection alone (lower left). H Time-course showing persistent proteinuria in NOH mice (red) after primary infection, followed by weekly OVA injections. I Representative flow cytometry plots illustrating CD69 and CD103 expression of renal OT-1 cells on day 35 after primary infection and weekly OVA injections. Dot plots depicting a higher percentage of double positive CD69+CD103+ OT-1 TRM cells (right) in kidneys of NOH (red) vs. wt mice (blue). J Summary analysis (n = 3/group) showing a decline of transferred OT-1 cells in peripheral blood of NOH (red) vs. wt (blue) mice after primary infection and weekly OVA injections. Bars and whiskers of dot plots depict means and respective standard errors of the mean (SEM). P values were calculated using unpaired student’s t test or one-way ANOVA with post-hoc Tukey’s multiple comparisons method if two or more groups were analyzed. All presented datasets are representative of at least three individual experiments with n ≥ 3 mice/group. Normalized MFIs were calculated by dividing the MFIs of each sample by the mean MFI of the respective wt group

