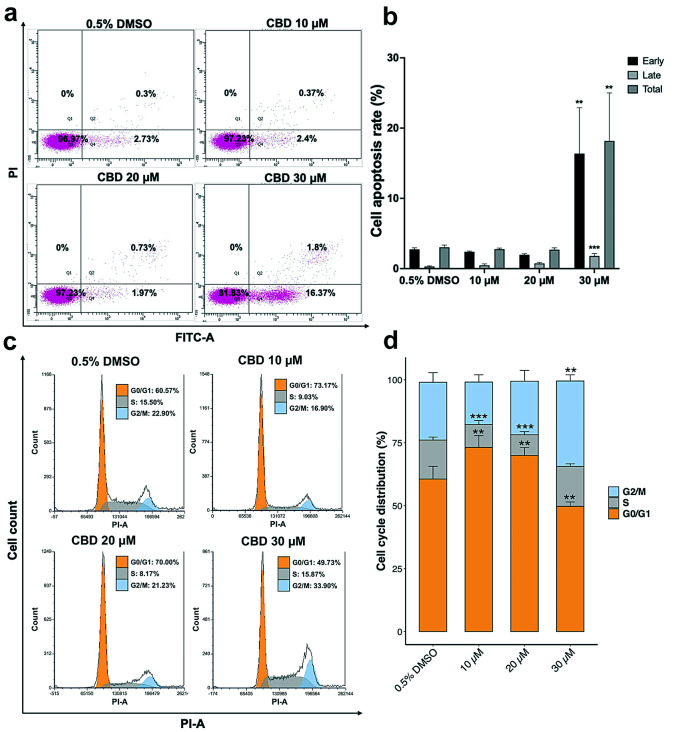
Fig. 3.
Flow cytometry was used to investigate the effect of CBD on apoptosis (a - b) and cell cycle arrest (c - d) in gemcitabine-resistant CCA cells (KKU-213BGemR). CBD was administered at concentrations of 10 µM, 20 µM, and 30 µM over a 24 h period, compared to a control group treated with 0.5% DMSO (a). To illustrate the apoptotic response, a bar graph was constructed (b) depicting apoptosis levels quantified by fluorescence-activated cell sorting (FACS) followed by labeling with annexin V-FITC and propidium iodide (PI). In addition, a stacked bar graph was constructed to show the distribution of cells across the different phases of the cell cycle as quantified by FACS analysis with PI labeling (d). Each experiment was performed in triplicate, and significant differences relative to controls are indicated as follows: * P < 0.05, ** P < 0.01, and *** P < 0.0001, respectively

