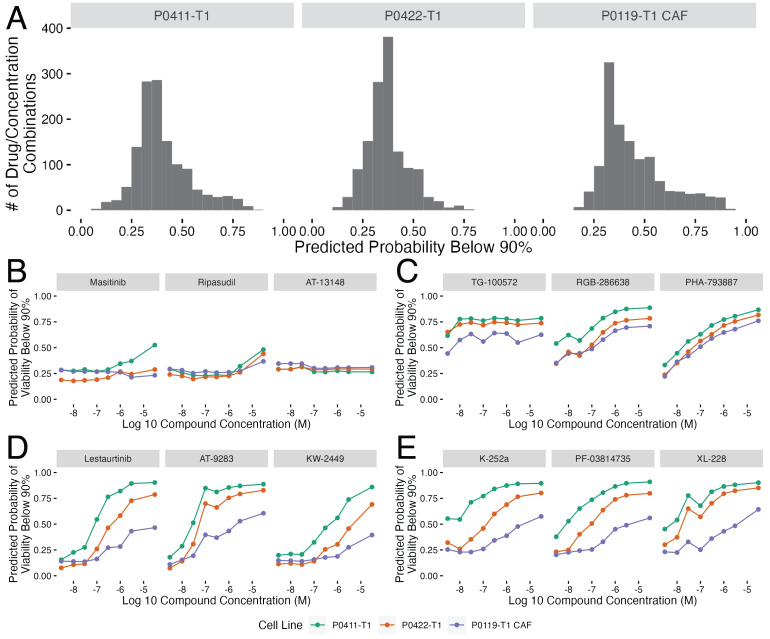
Figure 4. Random forest model predictions for clinical kinase inhibitors.
(A) Histograms showing the distributions of the probability of each compound and concentration combination having a below 90% cell viability effect. The distributions are split by cell line with the cell line name above each plot. (B–E) Plots showing the top three compound probabilities of a below 90% cell viability effect optimized for (B) predicted no drug effect (lowest average probabilities), (C) predicted drug effect (highest average probabilities), (D) differential drug response across concentrations(highest range of probabilities) and (E) differential cell line response (largest probability differences between cell lines). In parts B–E, plots are labeled by each predicted compound and colored by cell line shown in the legend below this collection of plots.

