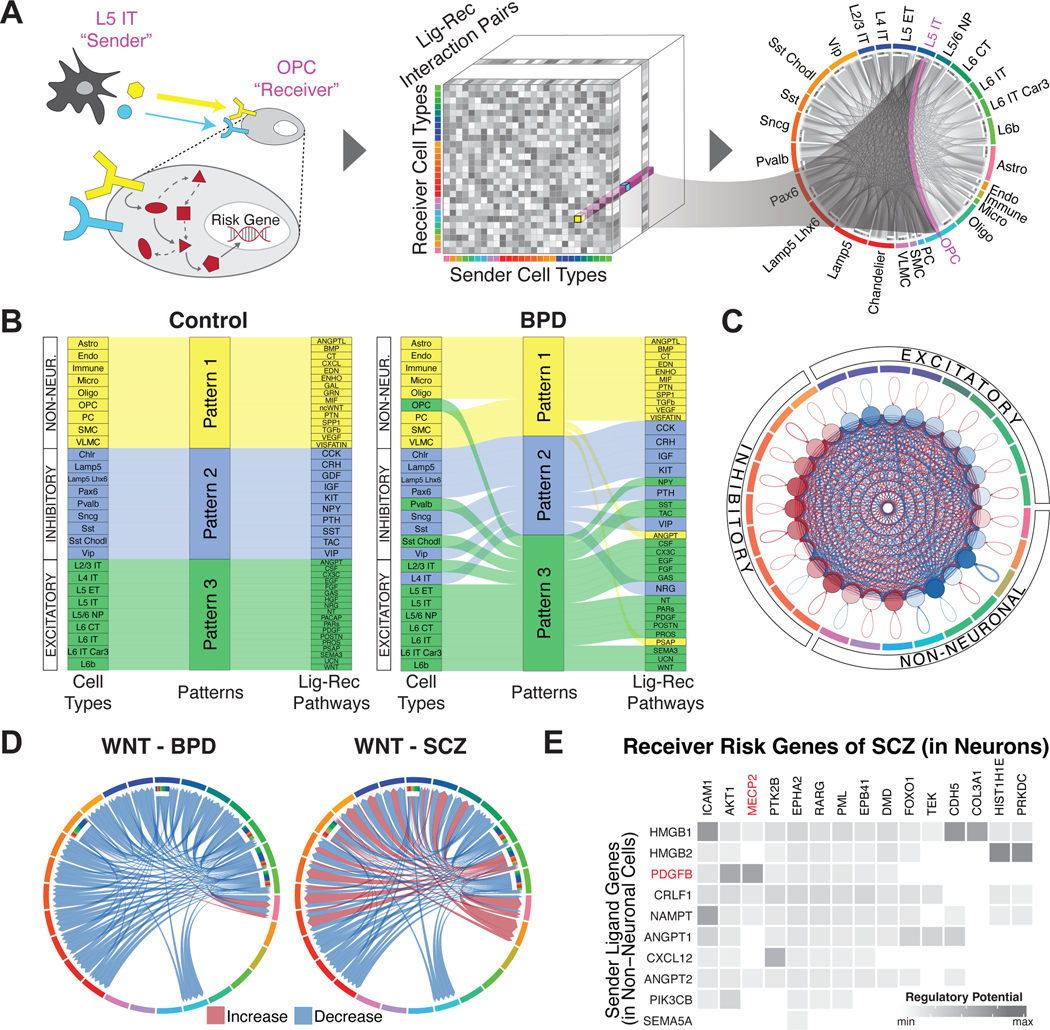
Figure 6. Constructing a cell-to-cell communication network.
(A) Schematic for the construction of cell-to-cell communication networks, based on a matrix of co-expressed ligand-receptor gene pairs in signaling pathways between sender and receiver cell types. Circos plot on the right shows the strength of all identified cell-to-cell interactions, highlighting L5 IT to OPC cell types as an example. Note that this model does not consider the synaptic connectivity between neurons. (B) Sankey plots for differential clustering of incoming interactions in receiver cells across cell types and ligand-receptor signaling pathways for control (left) and bipolar disorder (right) samples. For example, inhibitory Sst and Sst Chodl cell types were assigned to Pattern 2 in controls, along with the SST-SSTR signaling pathway. This makes sense, as these cell types are predominantly characterized by the SST gene. However, in BPD samples, Sst Chodl cells switched from Pattern 2 to 3, along with the SST-SSTR signaling pathway. (C) Circos plot showing differential strength of all cell-to-cell interactions between individuals with schizophrenia and control individuals. Red edges indicate increased interaction strength in schizophrenia samples, while blue edges indicate weaker interaction strength. (D) Circos plots showing changes in cell-to-cell interaction strengths for ligand-receptor genes in the Wnt signaling pathway between individuals with bipolar disorder (left) and schizophrenia (right) compared with control individuals. (E) Predicted likelihoods that ligand genes in non-neuronal cells (y-axis) regulate schizophrenia-associated risk genes (x-axis) in neuronal cell types, with the neurological risk gene MECP2 highlighted in red.

