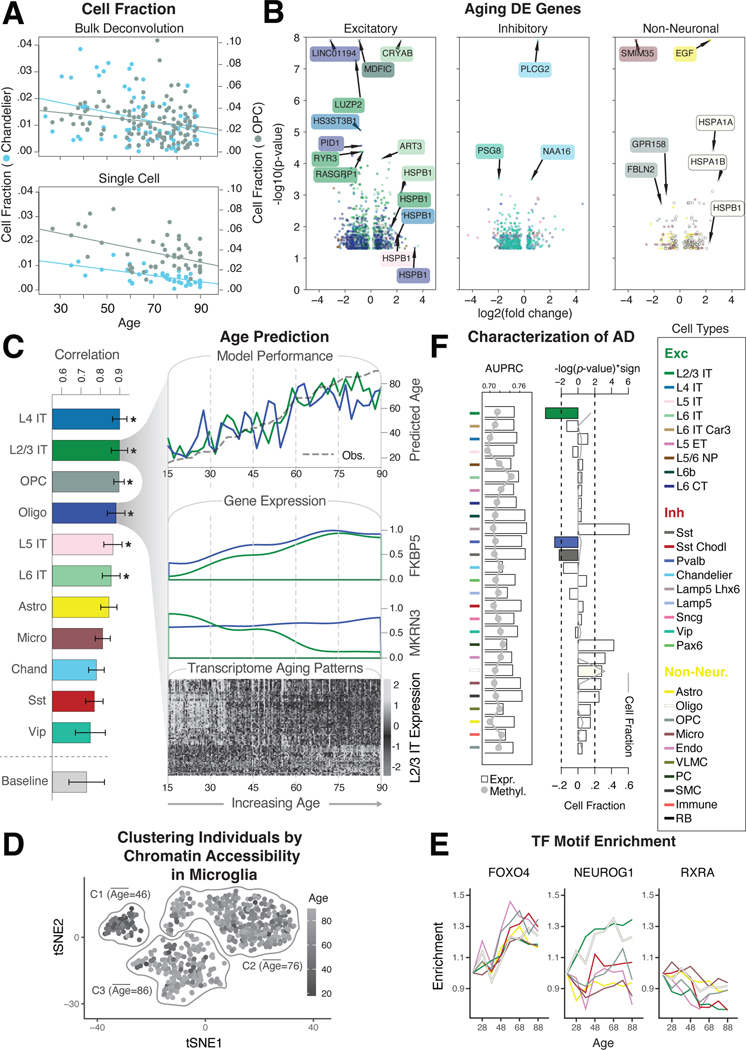
Figure 7. Assessing cell-type-specific transcriptomic and epigenetic changes in aging.
(A) Normalized changes in the fraction of OPC (gray) and Chandelier cells (blue) by age, based on bulk RNA-seq deconvolution (top) and single-cell annotation (bottom), with best-fitted lines. (B) Log2-fold changes and p-values from DESeq2 (20) for differentially expressed genes in older vs. younger individuals (±70 years) among excitatory, inhibitory, and non-neuronal cell types. Values with -log(p)>8 are shown as crosses. (C) (Left) Pearson correlation values between model prediction of age and observed age for each cell type and baseline model (covariates). (Top right) Predicted and observed age for oligodendrocytes and L2/3 IT neurons along the age spectrum. (Middle right) Transcriptomic profiles along the age spectrum of two key genes (MKRN3 and FKBP5) related to aging. (Bottom right) Genes demonstrate an increase (light gray) or decrease (dark gray) in expression along the age spectrum. (D) tSNE plot of chromatin peaks showing how chromatin patterns in microglia stratify younger and older individuals into three distinct clusters. (E) Examples of TF binding motifs that display distinct enrichment patterns across cell types and age. (F) (Left) Predictive accuracy (AUPRC) of cell-type-specific expression (bars) and methylation signatures (gray line) towards AD status. (Right) Enrichment of cell fraction changes among individuals with AD. L2/3 IT, Pvalb, and Sst (colored bars) are significantly associated with a decreased cell fraction in AD (log-p value, t-test). Gray line shows the overall median cell fraction of each cell type in AD individuals.

