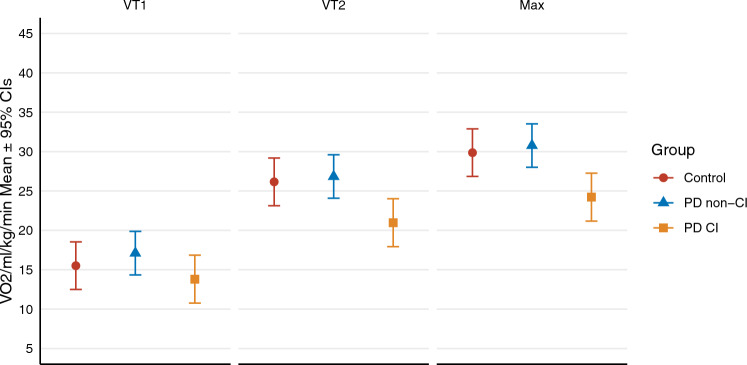
Fig. 3.
Represents the difference in oxygen consumption (VO2) at submaximal (first (VT1) and second (VT2) ventilatory thresholds) and maximal exercise intensities between groups. PD participants with blunted HR response (PDCI) presented significantly lower VO2 compared to both PD participants without chronotropic incompetence (PD non-CI) and the control group at VT2 (p = 0.003 and p = 0.036) and peak exercise (p = 0.001 and p = 0.023)

