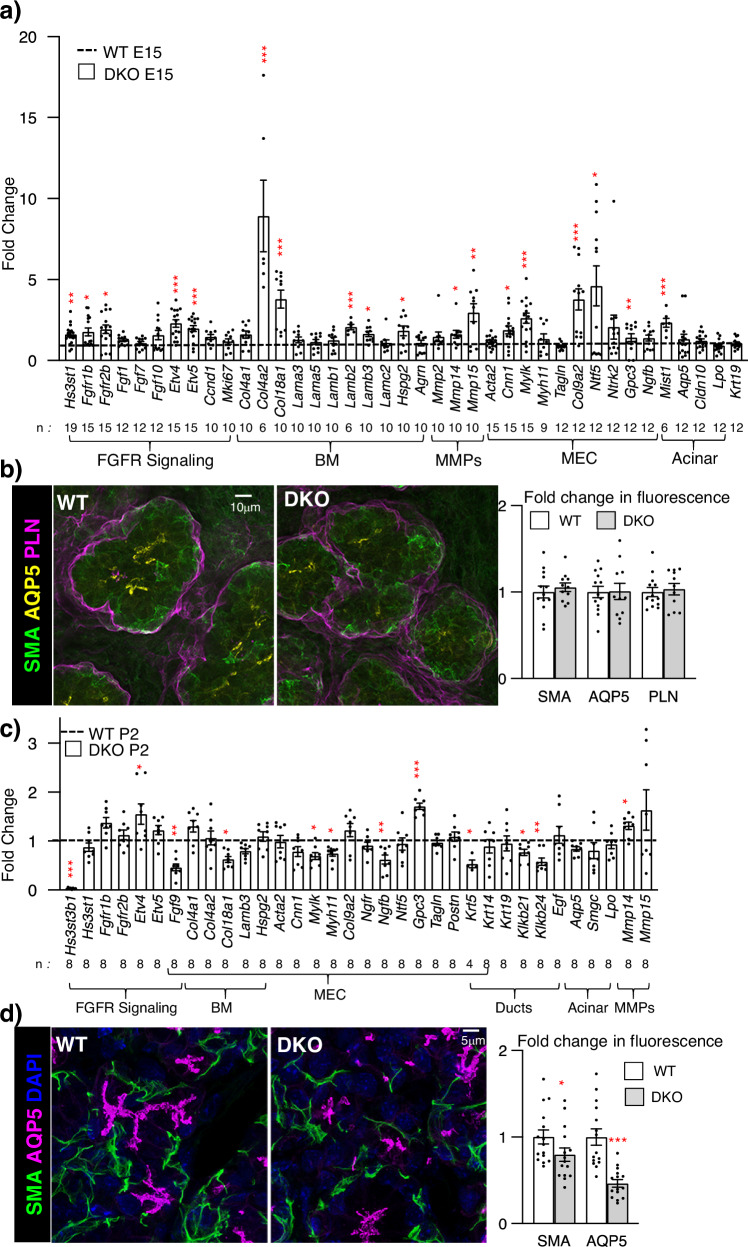
Fig. 6. E15 DKO SMGs have increased gene expression downstream of FGFR signaling, basement membrane components and MEC markers, but by P2 MEC gene expression is reduced.
a Gene expression changes in E15 DKO SMGs were normalized to WT control and Rps29. Error bars: SM. The n values indicate the number of SMGs analyzed. Unpaired two-tailed t-test compared to WT (Hs3st1 **p = 0.0014, Fgfr1b *p = 0.0167, Fgfr2b *p = 0.0229, Etv4 ***p < 0.0001, Etv5 ***p = 0.001, Col4a2 ***p = 0.0002, Col18a1 ***p = 0.0001, Lamb2 ***p = 0.0004, Lamb3 *p = 0.0119, Hspg2 *p = 0.0418, Mmp14 *p = 0.0191, Mmp15 **p = 0.009, Cnn1 *p = 0.0316, Mylk *p = 0.0004, Col9a2 ***p = 0.0002, Ntf5 *p = 0.0441, Gpc3 *p = 0.0086, Mist1 ***p = 0.0007). b Representative images show immunostaining at E16 with SMA (green) in MEC, AQP5 (yellow) in acinar apical membranes, and perlecan (magenta) in basement membrane. Scale bar, 10 µm. Graph shows quantification of protein fluorescence intensity normalized to total nuclei and expressed as a fold change compared to WT. n = 13 WT and 11 DKO SMGs. Error bars: SM. c Gene expression changes in P2 DKO SMGs were normalized to WT control and Rps29. Error bars: SM. The n values indicate the number of SMGs analyzed. Unpaired two-tailed t-test compared to WT (Hs3st3b1 ***p < 0.0001, Fgf9 **p = 0.0029, Gpc3 ***p < 0.0003, Klk1b21 *p = 0.0201, Klk1b24 **p = 0.0036, and Mmp14 *p = 0.0378). d Representative images showing immunostaining at P2 show SMA (green) in MEC, AQP5 (magenta) in acinar apical membranes, and nuclei (DAPI, blue). Scale bar, 5 µm. Graph shows protein fluorescence intensity quantification normalized to total nuclei and expressed as a fold change compared to WT. n = 15 WT and 15 DKO SMGs. Error bars: SM. Unpaired two-tailed t-test compared to WT, SMA *p = 0.0475, AQP5 ***p < 0.0001. Source data are provided as a Source Data file.

