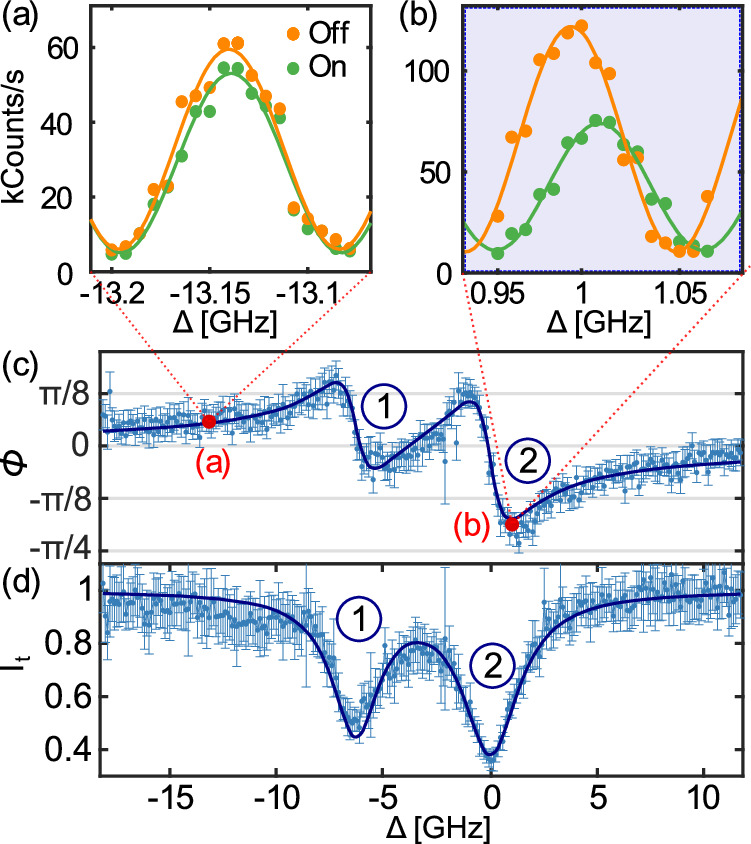
Fig. 2. Spectrum of the phase shift.

a, b Direct interferometric data with the emitter tuned “on” (green) and “off” (orange) resonance using the external electric field, for two different laser-emitter detunings (integration time of 100 ms per point). The measurement points are plotted along with corresponding sinusoidal fits (solid line). The data in b correspond to the detuning area marked in blue in Fig. 1b. c, d Extracted respective phase shift and transmission for the two dipoles, labeled 1 and 2. The solid lines correspond to the fit of the data to the theory. Errors bars represent the standard deviation of the signal.
