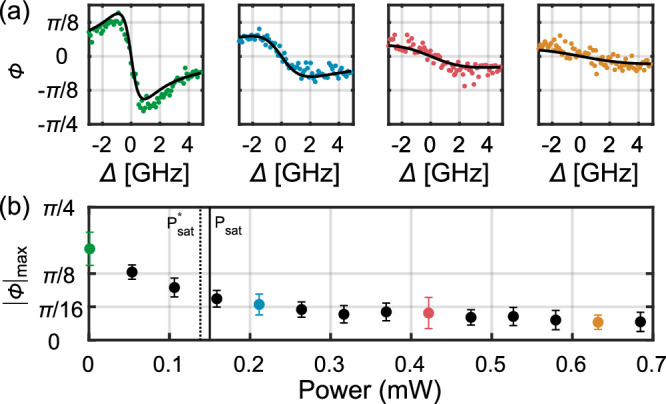
Fig. 3. Power response of the phase shift.

a Measurements of the phase response of the QD versus detuning and for different excitation powers. The solid lines are the fit to the theory of the overall data set. b Maximum measured experimental phase shift as a function of input power measured at , see Fig. 1a. The colored points correspond to the data shown in a. The full horizontal line indicates the calculated saturation power of the transition Psat = 0.15 mW. The dashed line indicates the saturating power mW of the maximal phase shift (See Supplementary Information). Errors bars represent the standard deviation of the signal.
