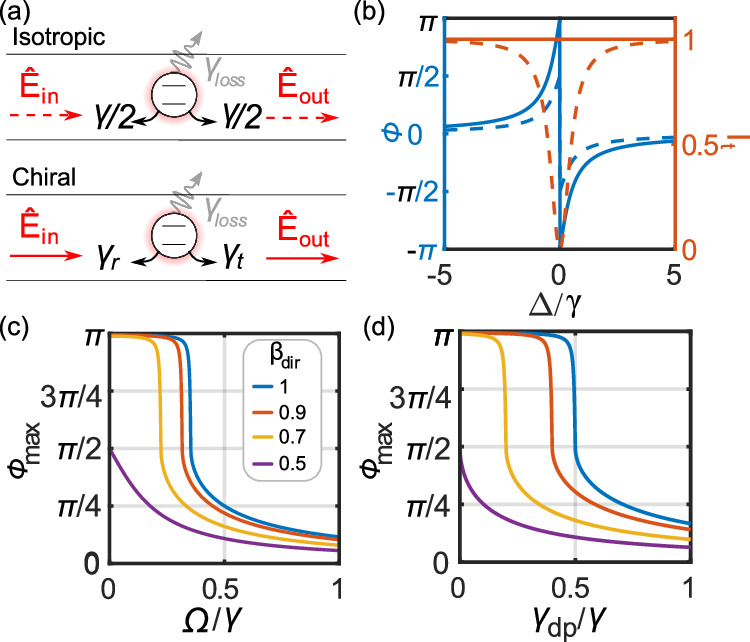
Fig. 4. Isotropic and chiral configurations.

a shows the scattering configuration for an isotropic and a chirally coupled system. In the latter, the reflection and transmission decay rates (γr and γt respectively) differ. Correspondingly, b shows the phase shift and transmission intensity for the isotropic (dashed line) and chiral coupling (full line). c Maximal phase shift as a function of the driving Rabi frequency Ω for different directional coupling efficiencies βdir = [1(blue), 0.9(red)0.7(yellow)0.5(purple)]. βdir = 0.5 corresponds to the case of an isotropic waveguide with β = 1. d as a function of the pure dephasing rate γdp for a series of coupling efficiency βdir = {1 (blue), 0.9 (red) 0.7 (yellow) 0.5 (purple)}.
