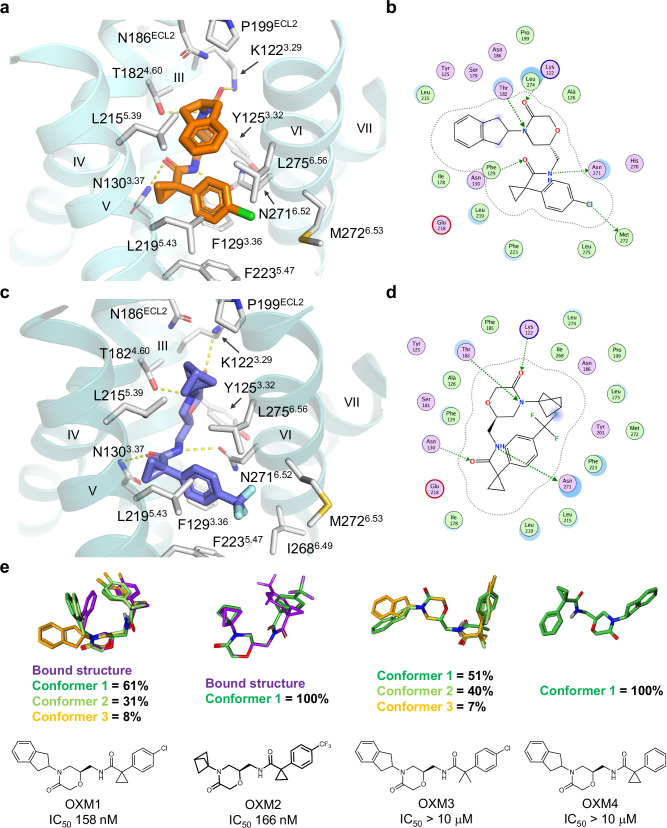
Fig. 3. Structures of OXM analogues bound to CCR6 and comparison to solution conformations.
a Binding pocket of OXM1 (orange carbon sticks). b Protein-ligand interaction diagram for OXM1 prepared with Molecular Operating Environment (MOE)52. c Binding pocket of OXM2 (slate carbon sticks). d Protein-ligand interaction diagram for OXM2 prepared with MOE52. In a and c, CCR6 protein is shown in aquamarine and deep teal ribbons, respectively. Side chains interacting with the small molecules are shown as white carbon sticks. Hydrogen bonds are highlighted by yellow dashed lines. In b and d, OXM pocket residues are presented as follows: polar residues in pink, hydrophobic residues in green, acidic residues with a red contour ring, basic residues with a blue contour ring. Green dotted arrows indicate hydrogen and halogen bonds mediated by side chains that contribute to ligand binding. Ligand atoms exposed to environment are shaded in blue according to degrees of exposure, scaled by size. Light-blue halos around residues indicate the degree of interaction with ligand, scaled by size. The dotted contour around the ligand reflects steric room for methyl substitution. e Chemical structures of different OXM analogues and their solution conformations were determined by NMR using residual dipolar couplings (RDC)30. Three most populated conformations are illustrated by dark green, light green, and orange carbon sticks, respectively. The bound conformations of OXM1 and OXM2 are shown as purple carbon sticks in the overlays for comparison. The IC50 value of each OXM analogue determined in the CCL20-mediated human CCR6+ T-cell chemotaxis assay is shown under the corresponding chemical structure. Solution conformer library files of the OXM analogues are provided as Source Data files.

