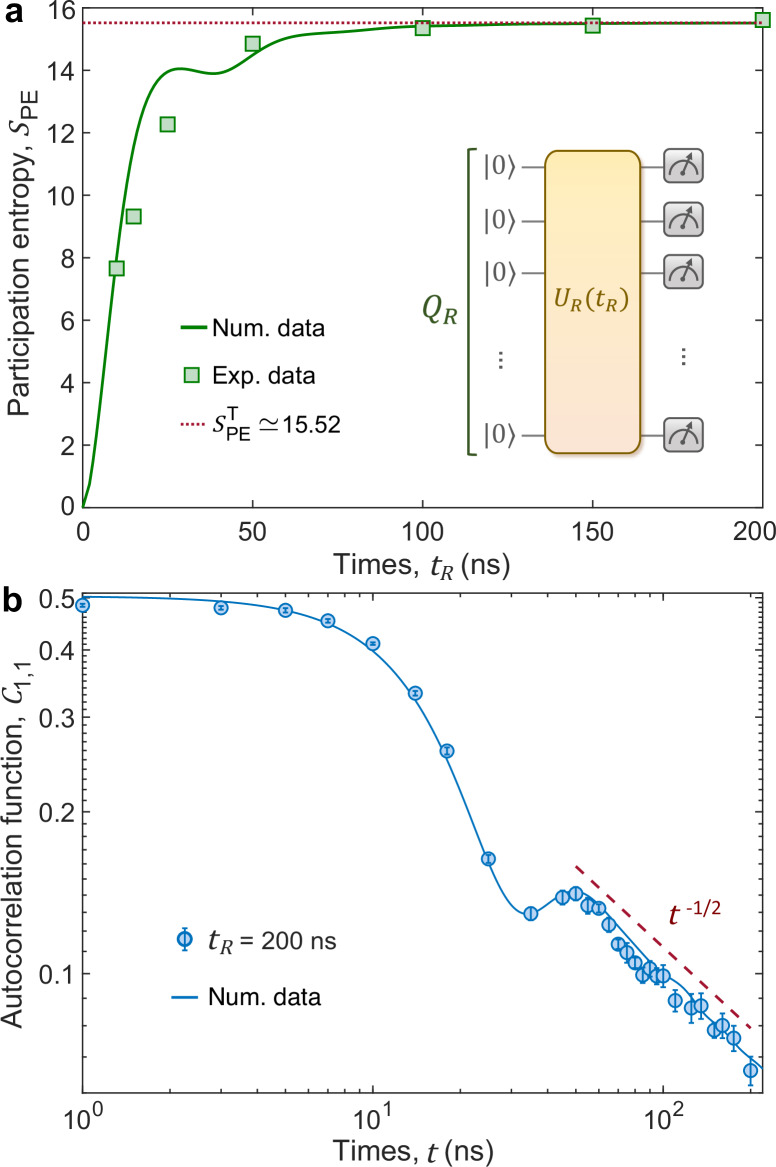
Fig. 2. Observation of diffusive transport.
a Experimental verification of preparing the states via the time evolution of participation entropy. Here, we chose QR = {Q1,↑, Q2,↑, …, Q12,↑, Q2,↓, Q3,↓, …, Q12,↓} with total 23 qubits. The inset of (a) shows the corresponding quantum circuit. The dotted horizontal line represents the participation entropy for Haar-random states, i.e., . b Experimental results of the autocorrelation function C1,1(t) for the qubit ladder with L = 12, which are measured by performing the quantum circuit shown in Fig. 1c, d. Here, we consider the state generated from with tR = 200 ns, which is approximate to a Haar-random state. Markers are experimental data. The solid line is the numerical simulation of the correlation function C1,1 at infinite temperature. The dashed line represents a power-law decay t−1/2. Error bars represent the standard deviation.

