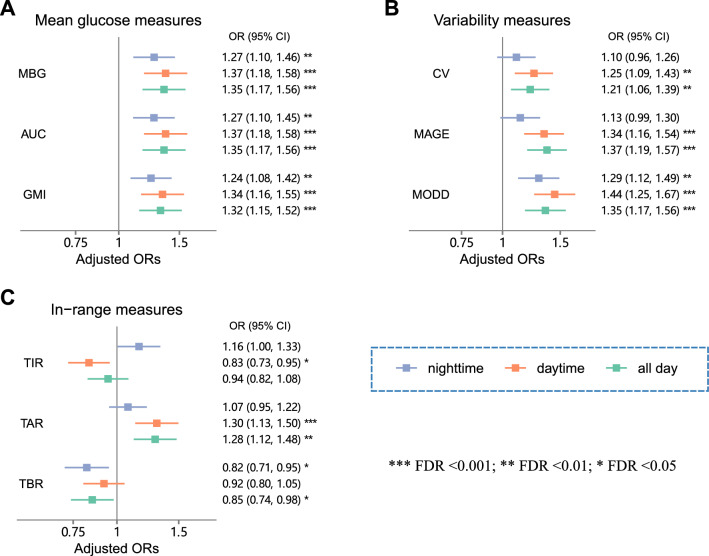
Fig. 1.
Associations of CGM-derived metrics with higher degree of hepatic steatosis. Forest plots present the ORs (95% CI) of mean glucose measures (A), variability measures (B), and in-range measures (C) for higher degree of hepatic steatosis. Multiple ordinal logistic regression models were performed to examine the associations of CGM-derived measures (normalized and standardized) with higher degree of hepatic steatosis, adjusting for covariates in model 2. False discovery rate (FDR) was applied to correct for multiple comparisons using the Benjamini–Hochberg method. ***FDR < 0.001; **FDR < 0.01; *FDR < 0.05. MBG mean blood glucose; AUC glucose area under the curve; GMI glucose management indicator; CV coefficient of variation; MAGE mean amplitude of glycemic excursions; MODD mean of daily differences; TIR time in range; TAR time above range; TBR time below range

