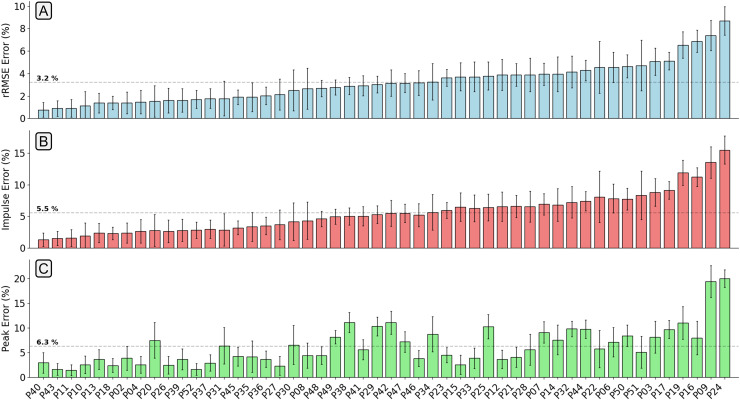
Figure 4. A bar chart showing the relative root mean squared error (rRMSE) (A), percentage difference in impulse (B), and percentage peak difference (C) between the measured and estimated vertical ground reaction force traces.
rRMSE is relative to the range of measured force values, percentage peak difference, and percentage impulse difference is relative to the normalised values. Each bar shows the mean error of all foot contacts for that participant and error bars show one standard deviation. The order of participants along the x-axis is sorted from smallest to largest mean rRMSE values.

