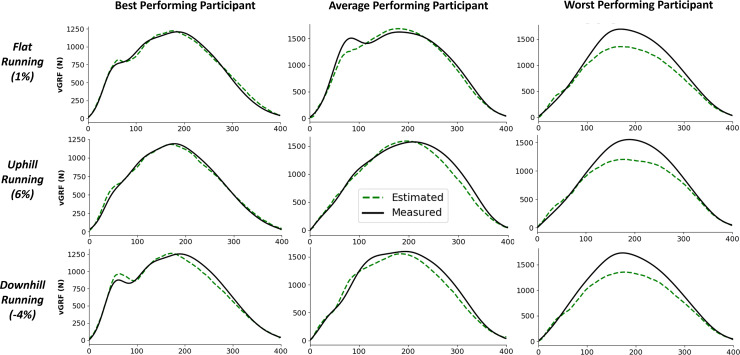
Figure 5. Example single representative foot contacts for flat (1% gradient), uphill (6% gradient), and downhill (−4% gradient) treadmill running for three example participants.
The left column shows vertical ground reaction forces ( ) from a participant that the model performed best on, the middle column shows data from an average performing participant, and the right column shows data from the worst performing participant. The solid black line shows the force measured from the instrumented treadmill (after 15 Hz cut off filter has been applied), the dashed green line shows the estimated force trace from the deep learning model.

