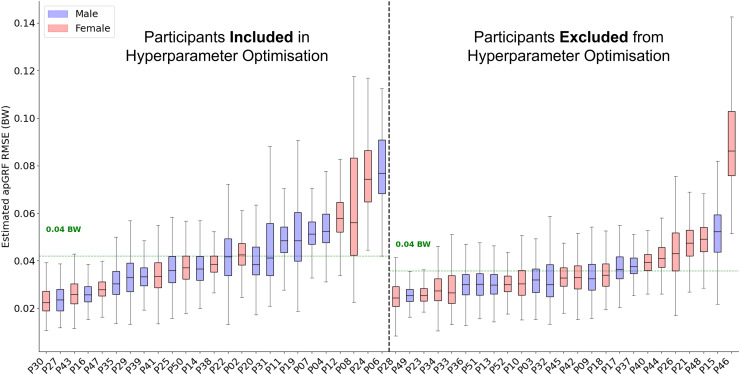
Figure 6. A box and whisker plot showing the root mean squared error (RMSE) of the Leave One Subject Out (LOSO) validation, using the previously selected hyperparameters for estimation.
The solid line within each box represents the median error across all foot contacts, the box spans from the 25th to the 75th percentile (interquartile range), and the whiskers encompass the interquartile range. The participants included in the hyperparameter optimisation process are shown in the left section of the graph, those not included are shown in the right section.

