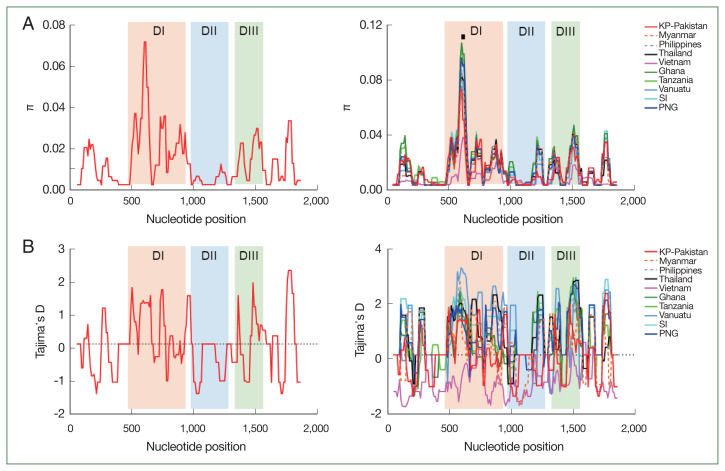
Fig. 2.
Nucleotide diversity and natural selection of pfama-1. (A) Nucleotide diversity. The sliding window plot showed nucleotide diversity (π) values across KP-Pakistan pfama-1 sequences (left) and global pfama-1 sequences (right). Cluster 1 of the loop I (C1-L) region showing the highest π peak is marked with a black line. A window size of 100 bp and a step size of 25 bp were applied. (B) Natural selection. The sliding window plot of Tajima’s D was analyzed for KP-Pakistan pfama-1 sequences (left) and global pfama-1 sequences (right). A window size of 100 and a step size of 25 were applied. DI, domain I; DII, domain II; DIII, domain III.

