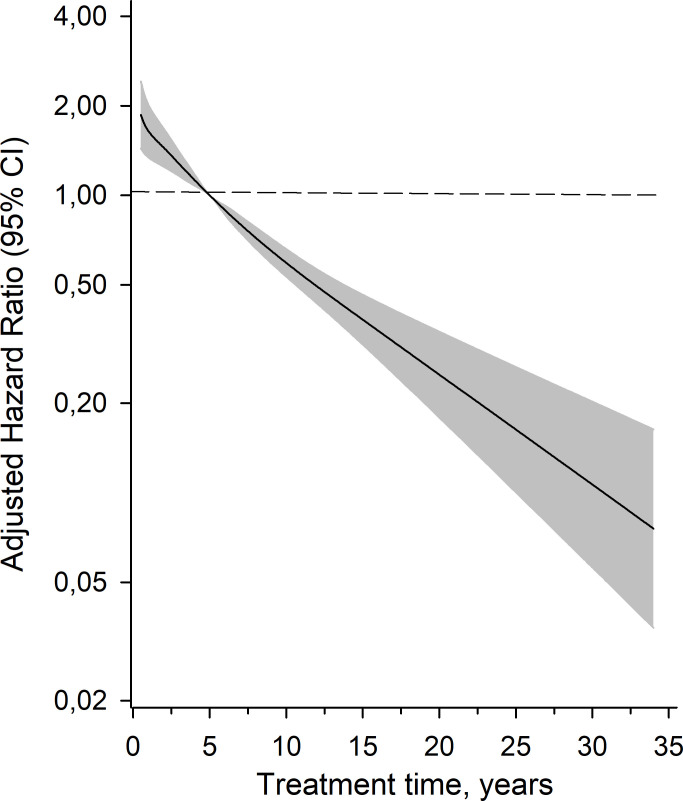
Figure 2.
Adjusted hazard ratios for all-cause mortality as a function of the treatment time years calculated model derived from a 3-knot restricted cubic spline Cox proportional hazards regression models. The median time (5 years) was set as the reference. The model was adjusted for age, sex and SUD. Gray area represents the 95% confidence intervals.

