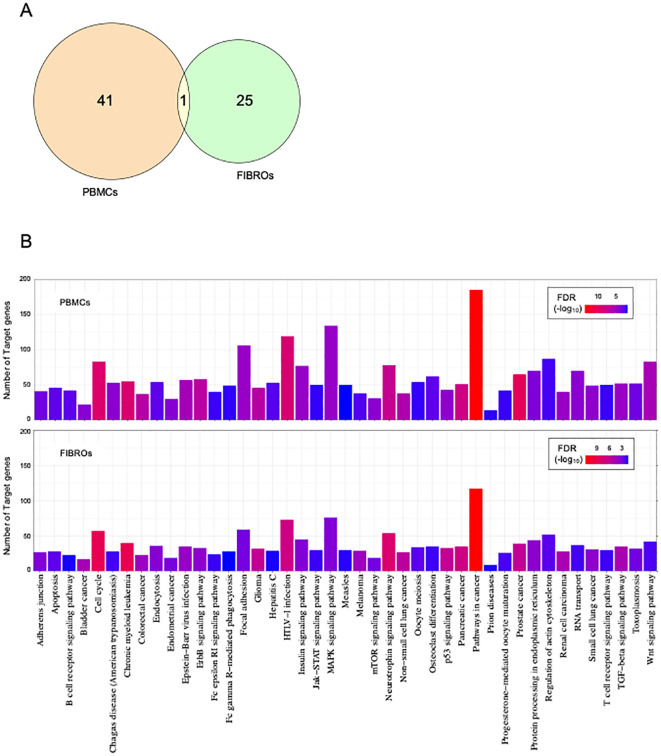
Figure 3.
Cross-analysis of AT PBMCs and fibroblasts. Venn diagram (or map) of intersection DE-miRNAs in AT (A). Indicated in orange are PBMCs DE-miRNAs; indicated in green are fibroblast DE-miRNAs; indicated in yellow are common DE-miRNAs. Enrichment analysis for target genes of DE-miRNAs in PBMCs at the top and in fibroblasts at the bottom (B). Significant KEGG pathways with FDR ¾0.05. The significance increases from blue to red.

