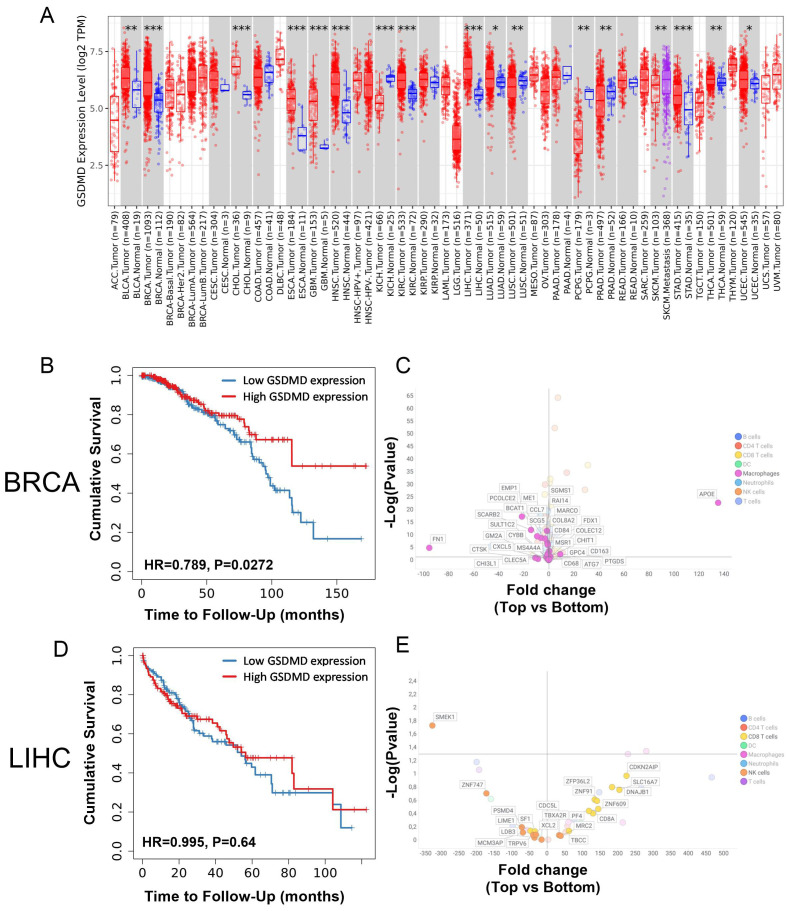
Figure 1.
(A) Differential GSDMD gene expression (Log2) between tumor (red) and adjacent normal tissue (blue) from the TCGA database. (B) Probability of overall survival for patients with top 25% (red) vs. bottom 25% (blue) GSDMD-expressing BRCA patients. (C) Fold change in the expression of genes associated with immune cell types in top 25% vs. bottom 25% GSDMD-expressing BRCA patients. Fold change represent the ratio of top 25% over bottom 25% GSDMD-expressing patients. (D) Probability of overall survival for patients with top 25% (red) vs. bottom 25% (blue) GSDMD-expressing LIHC patients. (E) Fold change in the expression of genes associated with immune cell types in top 25% vs. bottom 25% GSDMD expressing LIHC patients. Fold change represent the ratio of top 25% over bottom 25% GSDMD expressing patients. *p<0.05; **p<0.01; ***p<0.001.

