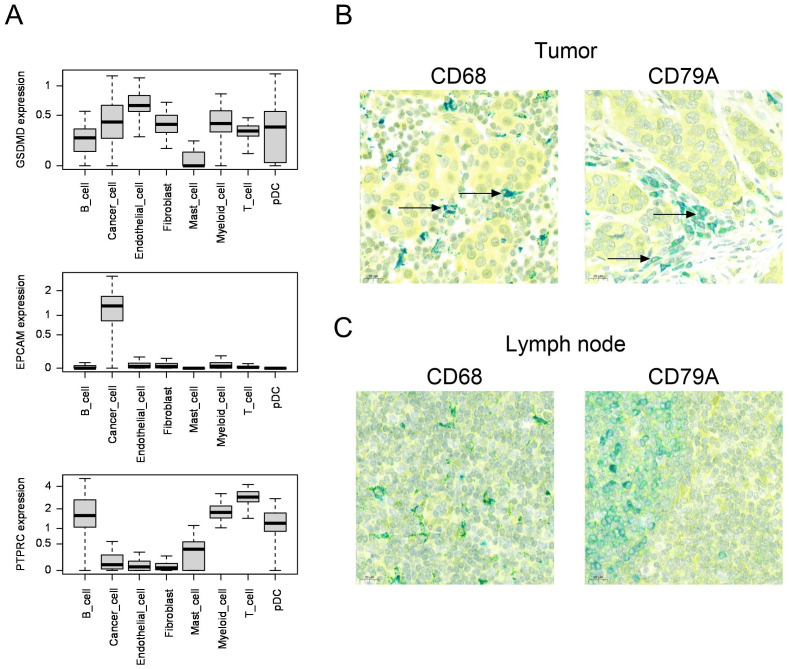
Figure 2.
(A) Boxplots comparing the distribution of per-sample, per-cell type average expression of the GSDMD, EPCAM (epithelial control) and PTPRC (immune cell control) genes, in scRNA datasets from Bassez et al. (breast cancer, n=84) 22 . (B, C) Human breast cancer (B) or lymph node (C) samples co-stained for GSDMD (yellow) and CD68 (macrophage marker, teal color) or CD79A (B cell lineage marker, teal color) by immunohistochemistry. Colocalization is indicated by green color. The arrows show colocalization of GSDMD and CD68 or CD79A.

