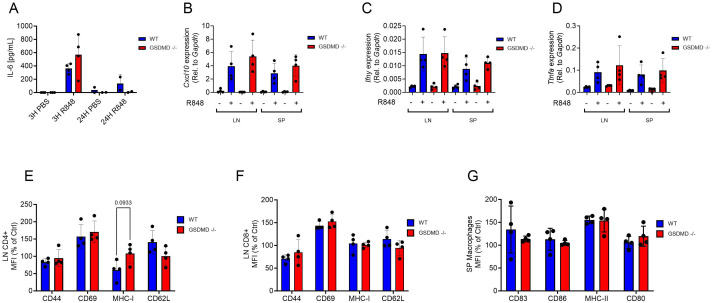
Figure 5.
(A) Systemic IL-6 levels 3h and 24h after R848 (10 μg, s.c.) or PBS injection in Gsdmd-/- and WT mice (n=4 per group). (B-D) Cxcl10 (B), Ifng (C) and Tnfa (D) gene expression in the lymph nodes (LN) and spleen (SP) after 3h of R848 or PBS treatment. (E, F) Cell surface CD44, CD69, MHC-I and CD62L levels on CD4+ (E) and CD8+ (F) T cells (CD3+) from the lymph nodes after 3h of R848 treatment. (G) Cell surface CD83, CD86, MHC-II and CD80 levels on macrophages (CD11b+, F4/80+) from the spleen (SP) after 3h of R848 treatment. ELISA graphs represent one experiment and each dot represent 1 mouse. In the qPCR data each dot represents the mean of a technical triplicate of each mouse.

