. 2024 Aug 28;14(8):e083603. doi: 10.1136/bmjopen-2023-083603

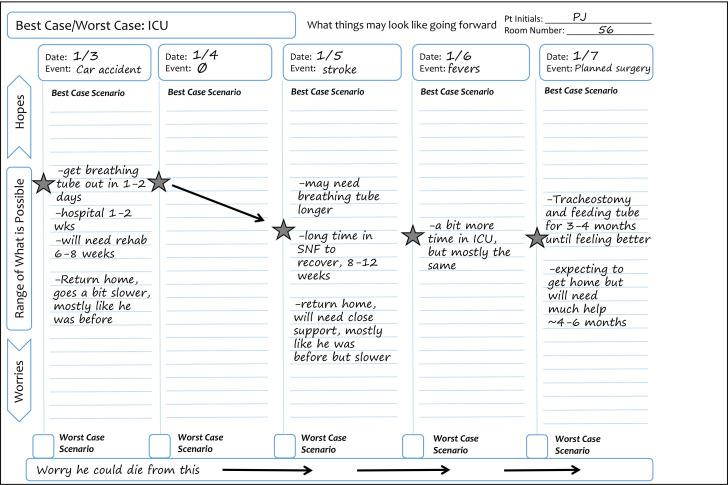
Figure 1. Example of the Best Case/Worst Case-ICU graphical aid. On each day of a patient’s ICU stay, the trauma team uses a preprinted graphical aid to review major events from the previous 24 hours and describe the patient’s overall health trajectory. On the graphical aid, each ICU day corresponds to a column, and the range of possible scenarios, that is, stories describing how this new injury could play out over time, are designated on a vertical line. A star distinguishes the ‘best-case scenario’ and a box designates the ‘worst-case scenario’. Each day, the trauma team will record any new major events at the top of the column. The star is moved based on how a new event, like a diagnosis of pneumonia or an improvement in neurological function after a stroke, changes the best-case scenario. Over time, the placement of the star goes up or down depending on how these events change the patient’s overall story. Arrows may be used to denote information is carried over from the previous day. SNF, skilled nursing facility.

Figure 1