. 2024 Aug 28;12(8):e008977. doi: 10.1136/jitc-2024-008977

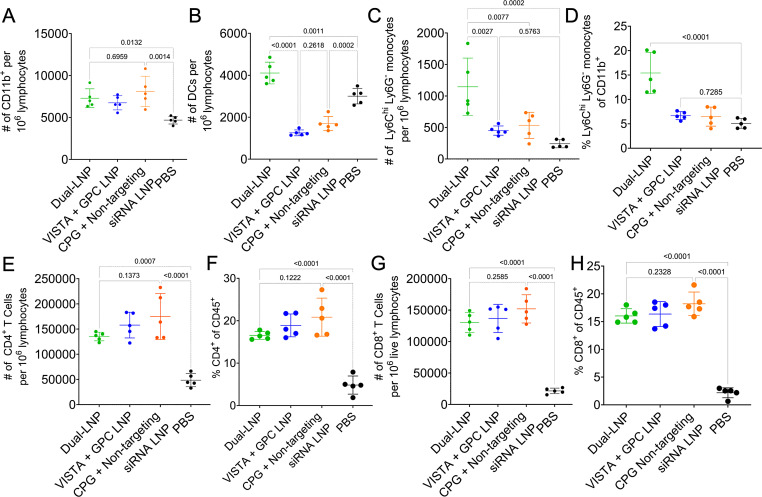
Figure 5. Myeloid immune cell profile of the tumor-draining lymph node 5 days after the initiation of the dual-LNP treatment. Flow cytometry analysis 5 days after treatment initiation with dual-LNP, control LNP (VISTA siRNA+GPC), or control LNP (CPG+non-targeting siRNA). (A) The number of CD11b+ myeloid immune cells per 106 lymphocytes. (B) The number of DCs per 106 lymphocytes. (C) The number of monocytes cells per 106 lymphocytes. (D) The percentage of CD11b+ myeloid immune cells that are monocytes. (E) The percentage of CD45+ immune cells that are CD4+ T cells. (F) The number of CD4+ T cells per 106 lymphocytes. (G) The percentage of CD45+ immune cells that are CD8+ T cells. (H) The number of CD8+ T cells per 106 lymphocytes. All experiments were performed with five mice per group. Statistics were analyzed by one-way ANOVAs with Tukey’s post-test. ANOVA, analysis of variance; LNP, lipid nanoparticle.

Figure 5