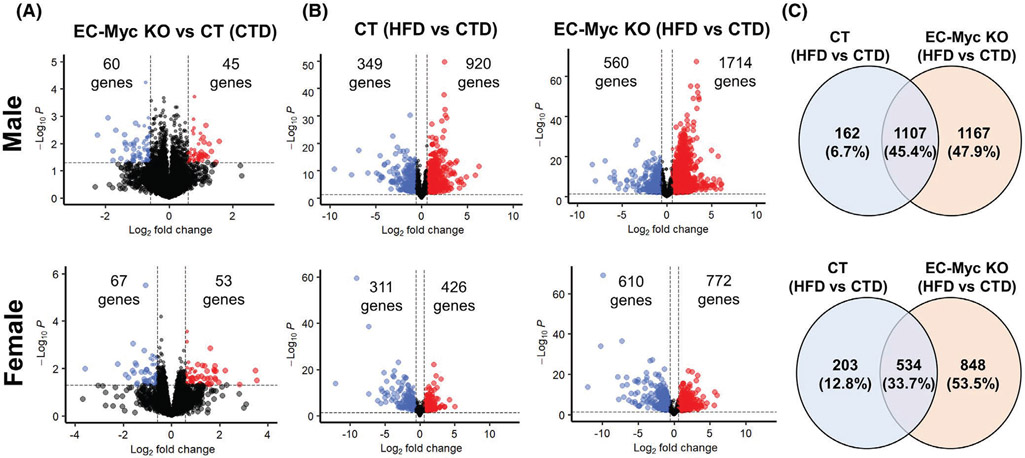
FIGURE 2.
Differential gene expression of CT and EC-Myc KO mice after short-term exposure to HFD. (A) Volcano plots indicating the number of genes significantly altered in EC-Myc KO mice relative to CT under CTD. (B) Volcano plots indicating the number of genes significantly altered by HFD exposure in CT and EC-Myc KO livers. (C) Venn diagrams indicating the number of genes significantly altered by HFD exposure in CT and EC-Myc KO livers. The top panels represent results in males (n = 4) and the bottom panels represent results in females (n = 3). CT, control; CTD, low-fat control diet; EC-Myc KO, endothelial c-Myc knockout; HFD, high-fat diet

