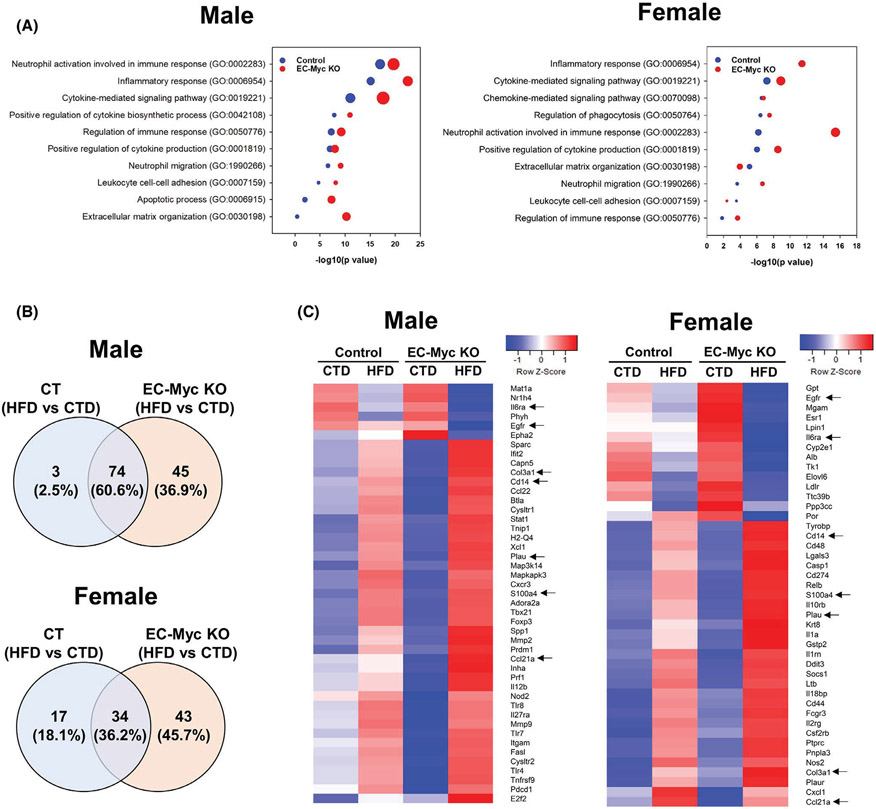
FIGURE 3.
Transcriptome analysis of inflammatory pathways in CT and EC-Myc KO liver after short-term exposure to HFD. (A) Gene ontology analysis of inflammation-related biological processes upregulated in male (left panel) and female (right panel) mice by HFD exposure in CT and EC-Myc KO liver. Dot size indicates the number of genes. (B) Venn diagrams indicating the number of inflammation-related genes in male (top panel) and female (bottom panel) mice significantly altered by HFD in CT and EC-Myc KO liver. (C) Heatmaps showing inflammation-related genes in male (left panel) and female (right panel) mice significantly altered exclusively in EC-Myc KO livers after HFD exposure (n = 3–4). Genes marked with black arrows are present in both male and female animals. CT, control; CTD, low-fat control diet; EC-Myc KO, endothelial c-Myc knockout; HFD, high-fat diet

