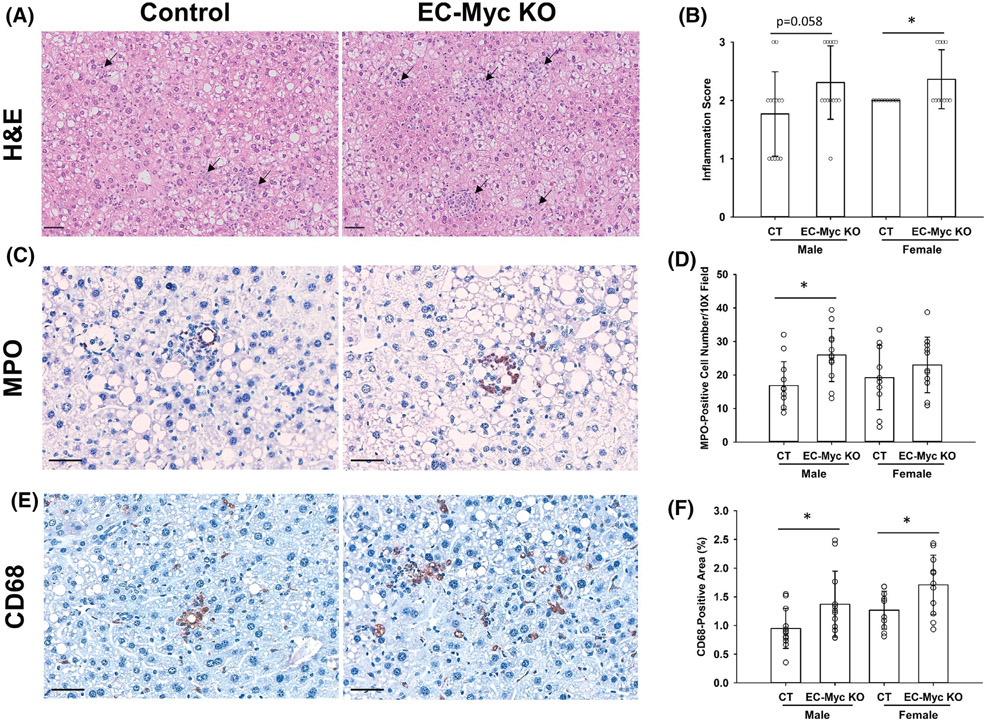
FIGURE 4.
Loss of endothelial c-Myc enhances HFD-induced leukocyte infiltration in the liver. (A) Representative images of H&E-stained liver sections of CT and EC-Myc KO livers after long-term exposure to HFD showing inflammatory foci (black arrows). (B) Analysis of inflammation degree. Results represent the score value for each individual animal. (C) Representative images of immunohistochemical staining for MPO on liver sections of CT and EC-Myc KO mice. (D) Quantification of MPO staining. Results represent the number of MPO-positive cells per 10× field. (E) Representative images of immunohistochemical staining for CD68 on liver sections of CT and EC-Myc KO mice. (F) Quantification of CD68 staining. Results represent the percentage of positively stained area relative to total tissue area (n = 10–13). Scale bar, 50 μm. CT, control; EC-Myc KO, endothelial c-Myc knockout; H&E, hematoxylin and eosin; HFD, high-fat diet; MPO, myeloperoxidase. *p < .05

