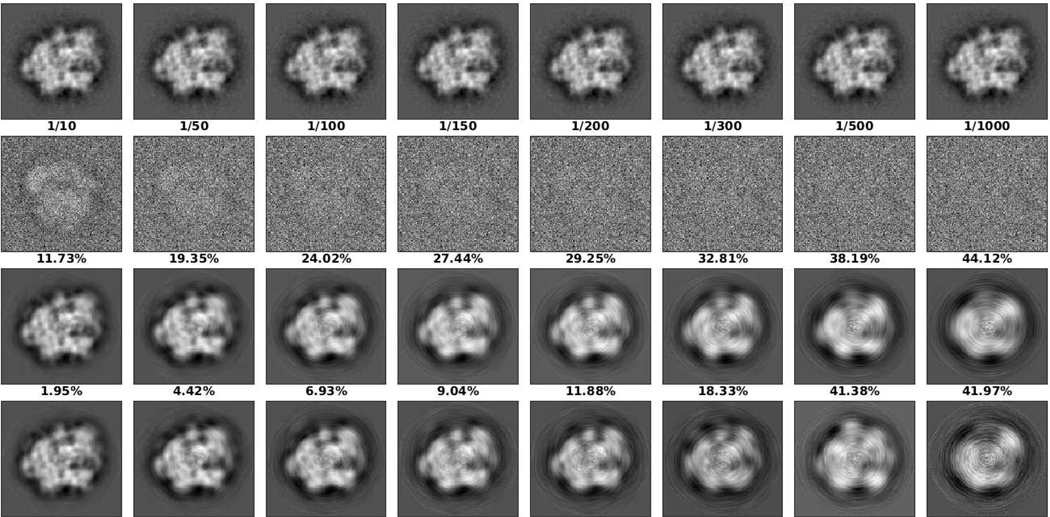
Fig. 4.
Recovery results for different SNR. The first to fourth rows of images are groundtruth images, noisy images, groundtruth images after sPCA, and recovered images, respectively. The first to third rows of numbers are SNR, relative sPCA error compared to groundtruth images (the first row), and relative estimation error compared to groundtruth images after sPCA (the third row), respectively. From left to right, the numbers of coefficients chosen by sPCA are 172, 88, 60, 45, 41, 33, 20 and 13.

