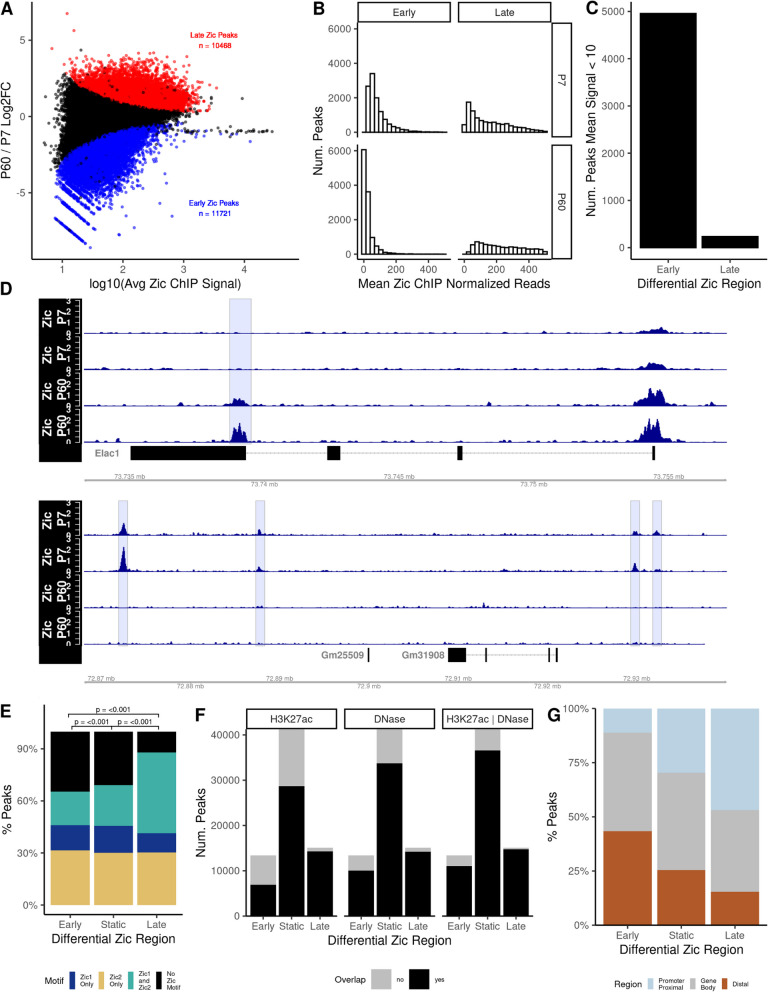
Fig. 1.
Zic1/2 binding is dynamic across mouse cerebellar development. A MA plot comparing Zic ChIP-seq peaks at P7 and P60. Red, significantly increased (“Late peaks”); blue, significantly decreased (“Early peaks”) (FDR < 0.05). B Distribution of the mean normalized reads in early and late Zic ChIP peaks at P7 and P60. C Total number of dynamic early and late Zic ChIP-seq peaks that were either completely lost as CGNs mature (Early) or newly gained between P7 and P60 (Late) as defined in the results text. D Example tracks of peaks that were lost as CGNs mature or gained between P7 and P60. E Proportion of Zic1 and Zic2 motifs found in the dynamic and static Zic ChIP peaks. F Overlap (black) or nonoverlap (gray) of Zic ChIP peaks with H3K27ac peaks, DNase hypersensitive sites (DHS), or both. G The distribution of dynamic and static Zic ChIP-seq peaks with respect to genomic features

