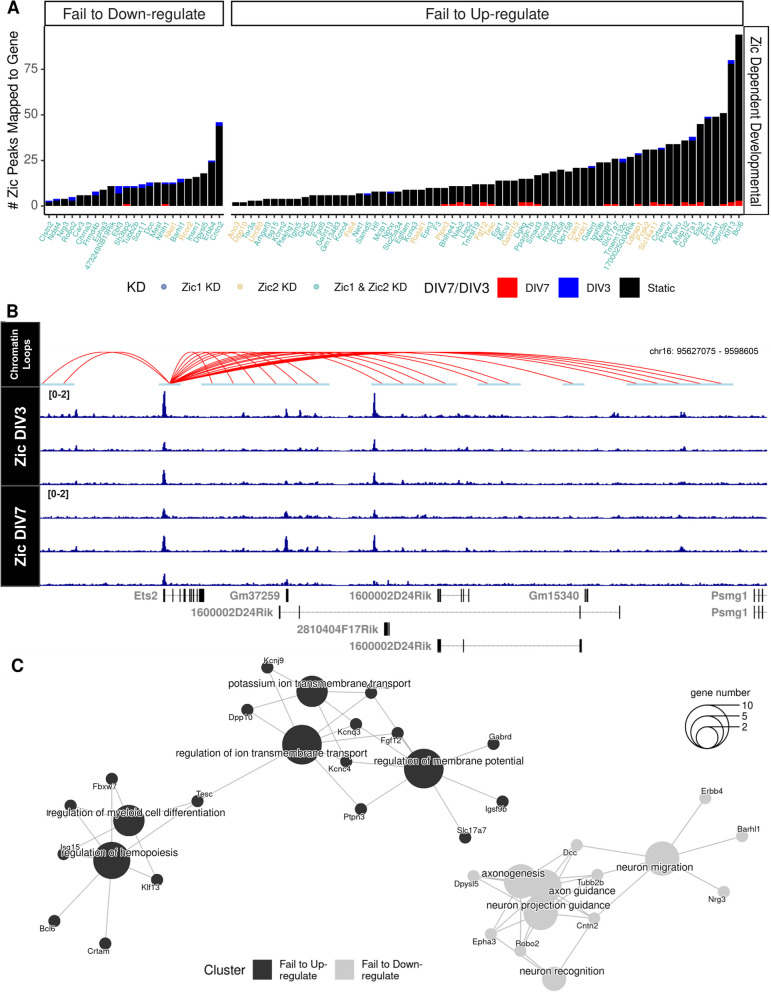
Fig. 5.
Candidate direct targets of Zic TF repression and activation converge on processes that underlie neuronal maturation. A Zic CUT&RUN peaks were mapped to each Zic-dependent developmental gene. Colors of the bar indicate the timepoint in which peaks are enriched (Blue, DIV3 enriched, red, DIV7 enriched, black, static) and colors of the genes indicate whether the expression of the gene was dependent on Zic1 (dark blue), Zic2 (yellow), or both (light blue). Genes are separated by their developmental up- or downregulation between DIV3 to DIV7 in CGN cultures. B Example track of static Zic TF binding with chromatin loops from cultured CGNs near a Zic-dependent gene that fails to upregulate upon Zic KD (Ets2). C Cluster diagram of biological process gene ontologies for genes that failed to be upregulated (black) and genes that failed to be downregulated (gray) in the Zic1 or Zic2 knockdown. The size of the center circle indicates the number of genes in each of the categories shown. The smaller circles show specific ZDD genes, and the lines connect those genes to their biological process category. Some genes are linked to more than one biological process

