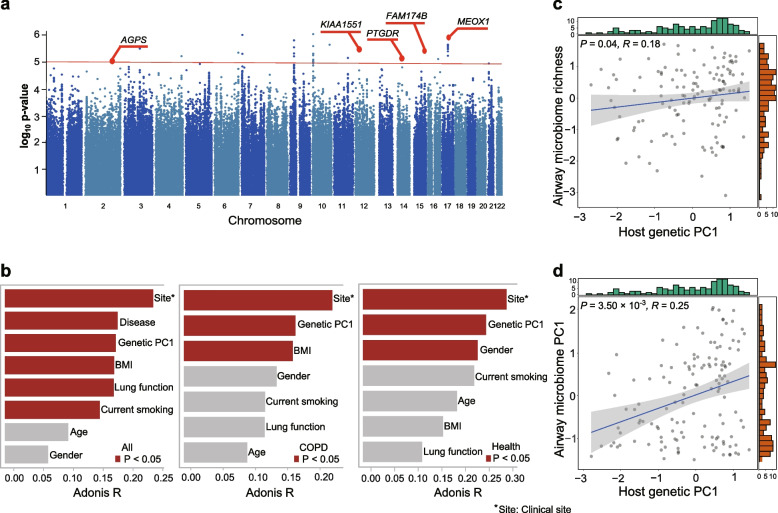
Fig. 2.
The relationships between host genetics and airway microbial diversity. a Manhattan plots of host genetic variants associated with lung function in COPD patients. The red line represents the P-value of 1.0 × 10⁻⁵. Two loci with the significance of genetic association above this threshold and previously identified to be COPD-associated were marked by their gene names (AGPS and PTGDR). b Barplots for the associations of the host genetics and other demographic and clinical variables with the airway microbiome in all the samples and within COPD or healthy individuals as assessed by PERMANOVA. The significant associations (P < 0.05) are highlighted in red. c, d Correlation of the first principal component of host genetic data (x-axis) with (c) microbial alpha diversity, and (d) the first principal coordinate of the airway microbiome beta diversity (y-axis). The green and red bars are histograms showing the distribution of the X and Y axis

