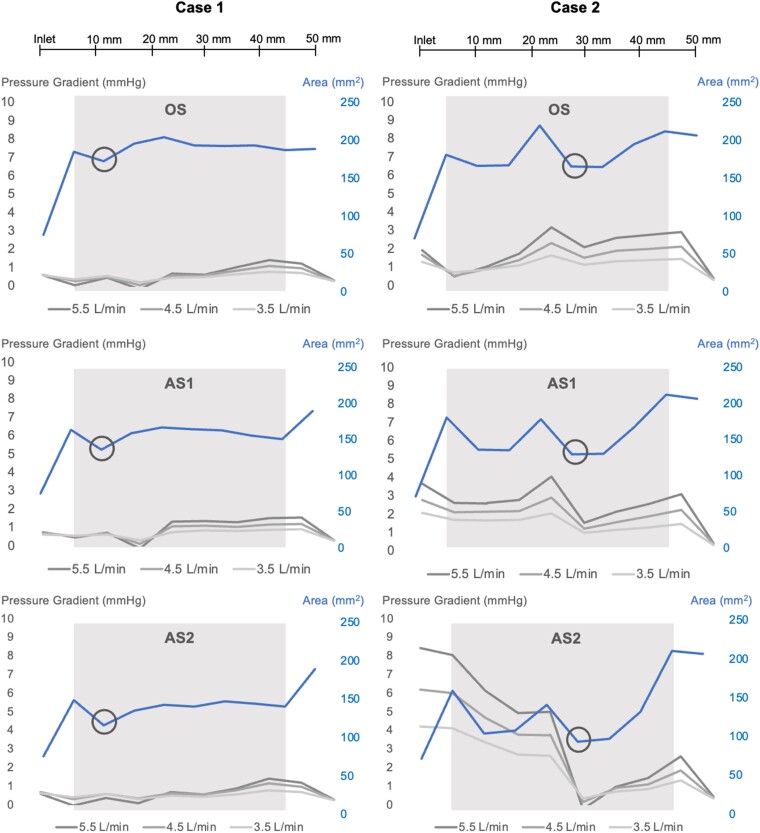
Figure 4.
Average pressure gradient (mmHg) along the outflow graft for the different stenosis severities, depending on device flow (L/min) and in relation to CSA (mm2). OS, original stenosis; AS1, augmented stenosis 1; AS2, augmented stenosis 2. Areas of light grey indicate the length of the stenosis, and black circles indicate the narrowest point within the stenotic segment.

