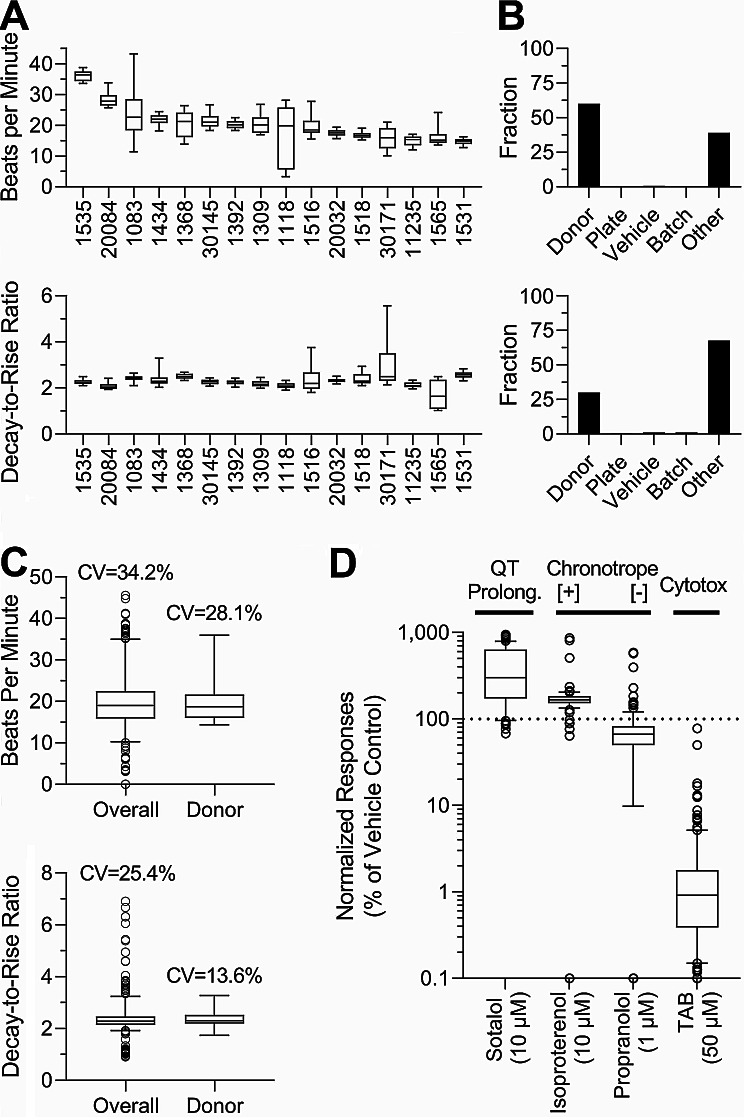
Fig. 2.
Inter-individual variability in baseline beating parameters and quality control assessment. (A) Baseline unstimulated beat rate (beats per min, top) and decay-to-rise ratio (bottom) for vehicle (DMSO, 0.5%) and media-treated wells across all donors were arranged by donor with the highest median baseline BPM rate. Boxes represent the interquartile range, with a line at the median and the whiskers at 10th to 90th %ile. (B) Histograms of technical and biological factor contributions for the total observed variability for both beat rate (top) and decay-to-rise ratio (bottom). The contributions to total variability include: Donor = diversity between donors, Plate = inter-plate variability, Vehicle = difference between effects of 0.5% DMSO (vehicle) and cell culture media, and Other = intra-plate variability. (C) Coefficients of variability (CV) for total (including both technical and biological) and biological (donor only) replicates. Box plots represent the interquartile range, and the whiskers show the 5th to 95th %ile across all donors. (D) Quality control assessment across various phenotype-specific (as indicated above each plot) positive control compounds (names and concentrations are shown). Box plots represent the interquartile range, and the whiskers show the 10th to 90th %ile across all donors

